I enjoy philosophy. Stoic philosophy in particular. Philosophy, I think, helps us revalidate our purpose. It acts as a yard stick and makes sure that we are not moving away from our First-Principles.
Applying the same to Software Engineering, in my opinion, every team should have a “Design Philosophy”. What is that one yard stick which teams can use for making better decisions. Infact, it is done in some forms in a few cases. Some call it Guiding-Principles. Some call it MVPs. I call it “Design Philosophy“.
The core idea is – Whenever a decision has to be made, if it is passed through this “Design Philosophy”, it should produce the same result, irrespective of who is making that decision.
As Engineer, we like equations, formulas and non-ambiguous ways of thinking. A written form of these Design Philosophies, for teams, does a lot of good in making the right decisions at a great pace. It is unfair for all Engineering teams to use the same yard stick. So people should write their own.
Below is my (opinionated) version for an Observability Engineering team.
Low latency is an important features for Observability signals. The ingested observability data should be available to the users at the earliest.
Observability tooling system is the torch in the dark. High reliability is a must. It cannot fail when the Platform / Application fails.
which means, Observability stack CANNOT fail when applications fail
which means, ideally, Observability stack shouldn’t be completely on the same platform as all Applications.
which means, Observability Vendors( buy decisions ) are not a bad choice. The choice of a vendor should be cost-effective for the Org.
for the O11y solutions that we decide to build in-house, Isolation is key.
Our O11y stack should support – availability, reliability and performance “cost-effectively“ at scale.
All the tools that we build and maintain should be vendor agnostic (sdks, collectors, refinery etc).
Rate of decay of data is fast in O11y. People care more about last 1hour/1day O11y data vs last 1month data.
When we opt into optimising cost in observability, it results in having more than one tool. While we can have different tools, we shouldn’t have many tools which do the same thing. Example:
Metrics → Prometheus, Traces → Jaeger (Fine)
Logs → ELK, Logs → Splunk (NOT-Fine)
Tools change. The tools that we have today for a specific function, might change to something else in a year or two. Observability team should strive to make the change least disruptive.
There is a clear view point on “what kind of observability signal, has to go where”. (Details on this here) Example:
count –> metrics
time –> trace
high cardinality –> log
These are the elements that I use when making an Observability decision. These might vary for a different team, who might be in a different situation. But the point I am really trying to make is, have a design philosophy that will make decision making easier.
There isn’t a single book or article on observability (O11y) where there isn’t a mention of MELT. (Metrics, Events, Traces, Logs) While these four are the building blocks of telemetry data in Observability, all the four components haven’t evolved at the same rate.
In this write-up, I delve into metrics in observability (mainly custom metrics) and argue how the overuse of metrics is turning into madness and directly impacting the cost of observability.
Metrics are the core entity of O11y in any application or platform component. For monitoring software, metric-based dashboards, SLOs, and alerts are far more common and are considered the current standard. Most of the popular O11y vendors/solutions available in the market, like Prometheus, Datadog, Chronosphere, etc., are predominantly metric-heavy solutions. Thanks to OTel, a standard is falling into place for metrics, and we are no longer tied to a single observability vendor for life.
Closer look at Metrics
When we speak about metrics, they generally fall into two categories:
Host metrics
Custom metrics
Host Metrics
Host Metrics are the system metrics that reflect the state of the system. These metrics help Engineers understand the Utilization and Saturation of the system. For example:
CPU : %used – Utilization , Load avrg – Saturation
Disk : Used space – Utilization, iops usage – Saturation
Network : Badwidth used Note that in all the above cases the Application Engineering team doesn’t have to generate any of these metrics. These are mostly system based (kube-state-metric) or agent-based provided by vendor (datadog-agent).
Metrics are traditionally stored in a Time Series Database (TSDB) which is datapoints collected and stored against time. Any aggregation that has tobe performed on the Metrics are precomputed and aggregation is performed at the write time and not the query time. Meaning, if you are interested in getting 95th% of your metric, the aggregation needs to happen while writing the data to the TSDB. These aggregations are generally configurable. Here is the case of Datadog where you can define the percentile aggregation that you want for all your metrics.
NOTE: In the context of datadog, any new aggregation added is treated as a custom metrics and you will be charged for it. More on that later.
The important point here is that all aggregations happen at the write level, and not the read level for metrics in a TSDB.
Custom metrics
This is the section on which I want to elaborate. These are the metrics which are emitted from within the application code. Custom metrics in an application always go through a journey. “No metrics –> Not enough metrics –> Who added these metrics? –> Remove these Metrics“
The above journey is a mess mainly because of :
lack of proper review on adding metrics
lack of understand on the cost impact of adding metrics (they can be really expensive. More below)
lack of value proportion thinking of adding a metric
Custom metrics are typically trying to measure either :
the count of an event (example: items processed, failures occurred) or
unit of time taken for a transaction (example: latency)
In my opinion, the best kind of customer-metrics are those which are customer experience centric. Any metric that is just added to measure a new-feature should always be temporary in nature. I also have a strong opinion on the use of custom metric for measuring latency. I believe anything that we want to measure as a unit of time (latency, response time) – should be emitted as a trace signal rather than metric. This leads us into Metrics vs Trace debate.
Metric vs Traces
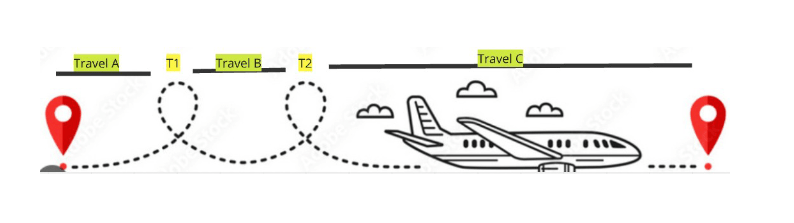
Metric vs Trace for measuring latencies. Lets consider a use case of taking a long flight, which has two stop overs.
If measuring the total travel time was a usecase, it is so much easier to emit a trace for end-to-end time. Then you can also break the time for TravelA, TravelB, TravelC and Terminal wait times using Spans within a Trace. Now imagine emitting a metric for this. You will end up emitting 5 metrics for this, which will all be independent and you have to stitch them some dashboard. It would be an absolute pain.
Some people would ask, “But what about sampling of traces?” Yes, traces are sampled, but so what? With latency signal, you generally want to measure if a transaction was slow or if it took more than usual amount of time during some part of the day. Even with Sampling on the traces, you will be able to see the slowness for a given period of time. See the case below, which has two plots with 50% sampling. You can still see the high latency on sampled requests.
Also, traces are less expensive mostly, based on the tool you use. I am an advocate for traces as a signal for feature any latency/response-times for above reasons.
Cost of Custom metrics
Going back to custom metrics, they can get really expensive really quick, if not kept a close watch on. The billing for custom metrics is not very straight forward to understand. For example – Datadog custom metrics billing page here could easily leave you wanting for more coffee.
At the crux of it, custom metrics billing depends on :
number of unique metrics that are emitted
number of unique tags that are associated with metrics
Since metrics are stored into a Time Series Database – TSDB (generally), custom metrics are always plotted against the function of time. When stored on a TSDB its a unique entry per epoc time and per unique attribute (tags) emitted on the metric (as see in the prometheus dump file below)
To explain in more simple terms, consider the below example of request.latency metric which is emitted from 2 hosts, measuring from 3 EndPoints and collecting two unique status codes.
source: datadog page
This above single request.latency custom metric will lead into 4 unique metrics.
host:A, endpoint:X, status:200
host:B, endpoint:X, status:200
host:B, endpoint:X, status:400
host:B, endpoint:Y, status:200
Now lets say if you have 2000 hosts, you want to latency from 4 end points and include 5 different status codes, then that would be : 2000 X 4 X 5 = 40,000Custom metrics from a single metric request.latency above.
On top of it, instead of Count metric – if you emit Histogram metrics, that would include “max, median, avrg, 95th %, count” for each metric. That mean 5 times more metrics being emitted : 40,000 X 5 = 200,000 Custom metrics from a single metric request.latency for histogram type. More on metric-types here
This combination of metrics and tags leading to unique entries in a TSDB is called high cardinality. This leads to exponential increase in the cost of observability.
In the case of Datadog, 100-200 custom metrics are included per host. Above which they charge between 1-5$ per 100 custom metrics based on the plan. Any standard maturated product, lets assume has 100 custom metrics (they are alway in 1000s). A rough math on extrapolating above calculation will lead to 20million custom metrics. With the least pricing model, that is 20,000$/month bill.
The point I am trying to make here is, if custom metrics are added without giving it enough though or if incorrect metric type(link) is used, it can get really expensive. If you use wrong data model, you will suffer.
So what do we do with Metrics?
Custom metrics are decade old and well wetted signals in observability. I am not trying to make a case to move away form them altogether. However, if used incorrectly or overused for all cases, they can really come back and hurt us. A few things that I recommend as take aways:
when measuring latency/response-time as a signal – always lean towards Traces. Don’t worry too much about sampling. It doesn’t matter as shown above.
use the right form of metrics. If you use Histogram without needing it, instead of Count, you are emitting 5Times more metrics.
use tags very cautiously on metrics. Avoid high cardinatlity tags like – epoc times, request id, keys, uuids on metrics.
be very mindful about the retention of these metrics. If you want larger retention, you will end up building a data-management team instead of Observability team.
Periodically review the metrics that are present in your system. If a metric is not a part of any Dashboard, Alerts or Monitors – you probably don’t need it. Remove them.
Monitor your custom metric usage on observability solutions. Have alerts and anomaly detection for this. Check this very closely like “there is no tomorrow”. You will be surprised by how bad it will get in not time, if you loose site of this.
many a times you might want to ingest tags on metrics, but not index them always (Context is what gives data meaning and power). You might want to index them only when absolutely needed. This mean you cannot group a metric based on “ingested” high cardinality tags, but it will reduce the cost by multiple folds.
poll less often or increase the window size for “not so critical” services
if you have the resource and bandwidth, build a transformation layer before storing the metric. Use the data on transformation layer for all alerting and plotting. Aggregate and store lesser data for long term retention. But this is a larger effort.
Most of the suggestions above are from my personal experience where I have implemented these changes. Happy to hear your thoughts in the comments below.