Prometheus: Static/Dynamic scraping on EKS

This note is a mental model for how Prometheus discovers and scrapes metrics in Kubernetes.

The lens I want to keep throughout is:

  1. Where will the scrape config file sit?
    (Prometheus repo vs application repo)
  2. In which namespace will the serviceMonitor sit?
    (and how Prometheus finds it)

At a high level there are two ways to tell Prometheus about a /metrics endpoint:

  1. Static via in the Prometheus config file.
  2. Dynamic via (CRD from Prometheus Operator) with label‑based discovery.
  1. Approach 1: Static scrape_config:
    1. How question:
    2. Where question:
  2. Approach 2: Dynamic scraping with ServiceMonitor
    1. How question:
    2. Where question:
      1. (1) Watch service monitor in all Namespaces.
      2. (2) Watch only specific Namespaces
      3. (3) Watch only Prometheus Namespace.
    3. Below is the workflow of Dynamic, label-based Discovery of a scrape endpoint:

Approach 1: Static scrape_config:

This is the traditional way: you manually configure a scrape job in prometheus.yaml.
The natural questions here are:

  • How do I configure the scrape_config job?
  • Where will that config YAML file sit? (Prometheus repo or application repo?)

How question:

You define a scrape_configs job in the Prometheus config:

scrape_configs:
  - job_name: 'otel-collector'
    scrape_interval: 120s
    static_configs:
      - targets: ['otel-collector:9090']
    metrics_path: '/metrics'

Prometheus will then call: GET http://otel-collector:9090/metrics on configured interval.
An example in otel-contrib repo – here

Where question:

In this model the scrape config is centralized in the Prometheus deployment repo.

prometheus-deployment-repo/            #Platform team owns
├── prometheus.yaml                    # Main config with scrape_configs
├── prometheus-deployment.yaml
└── prometheus-configmap.yaml

otel-collector-repo/                   # App team owns
├── deployment.yaml
├── service.yaml
└── otel-collector.yaml
# NO prometheus.yaml here

This is a very manual contract between the application and the Prometheus and potentially has problems with Day1 and Day2 operations, as the application evolved.
Everytime there is a change in applicationName or Port, the same changes will have to put on the Prometheus repo as well. Failure of which will lead into scrape failures.

Approach 2: Dynamic scraping with ServiceMonitor

Rather than manual, there is also an option of Dynamic discovery of a new endpoint on EKS that prometheus can figure out it has to scraped.
This is done via ServiceMonitor which is a CRD from Prometheus-operator. Details here

Once serviceMonitor CRD is present in the cluster, the Prometheus-operator then:

  • Watches ServiceMonitor resources in the EKS cluster.
  • Translates them into Prometheus scrape configs.
  • Updates the Prometheus server configuration automatically.
    Note that, if ServiceMonitor CRD is present, other tools can just set the variable true for serviceMonitor in their helm charts and start getting scraped by prometheus.

Looking through serviceMonitor from the lens of :
How to configure serviceMonitor for my app ?
Where (which namespace) should I push my serviceMonitor to ?

How question:

Configure a kind: ServiceMonitor kubernetes resource in the application repo. Example of the same below.

apiVersion: monitoring.coreos.com/v1
kind: ServiceMonitor
metadata:
  name: otel-collector
  namespace: otel-demo
  labels:
    prometheus: fabric        # Must match Prometheus selector
spec:
  selector:
    matchLabels:
      app: otel-collector     # Selects Services with this label
  namespaceSelector:
    matchNames:
      - otel-demo
  endpoints:
    - port: metrics           # Port NAME (not number!)
      interval: 120s

So the How for dynamic scraping is: “Define a ServiceMonitor next to your Deployment and Service in your app repo.”

Where question:

With static scrape_config, the “where” question was: which repo owns the config file?With ServiceMonitor, the YAML lives in the app repo, so the “where” question shifts to:

In which Kubernetes namespace should I deploy the serviceMonitor so that Prometheus discovers it?

This is controlled by the serviceMonitorNamespaceSelector field in the Prometheus CRD.

apiVersion: monitoring.coreos.com/v1
kind: Prometheus
metadata:
  name: platform-prometheus
  namespace: prometheus-platform
spec:
  serviceMonitorSelector:
    matchLabels:
      prometheus: platform       # only watch SMs with this label
  serviceMonitorNamespaceSelector: {}

Prometheus can be setup in 3 different ways to do this:

(1) Watch service monitor in all Namespaces.

Prometheus Operator watches every namespace for ServiceMonitors with label prometheus: fabric in below example.

apiVersion: monitoring.coreos.com/v1
kind: Prometheus
metadata:
  name: fabric-prometheus
  namespace: prometheus-fabric
spec:
  serviceMonitorSelector:
    matchLabels:
      prometheus: fabric
  serviceMonitorNamespaceSelector:
    {} # Empty = all namespaces
(2) Watch only specific Namespaces

Only ServiceMonitors in namespaces labeled monitoring: enabled are picked up in below example.

apiVersion: monitoring.coreos.com/v1
kind: Prometheus
metadata:
  name: fabric-prometheus
  namespace: prometheus-fabric
spec:
  serviceMonitorSelector:
    matchLabels:
      prometheus: fabric
  serviceMonitorNamespaceSelector:
    matchLabels:
      monitoring: enabled  # Only namespaces with this label
(3) Watch only Prometheus Namespace.

ServiceMonitors must be in prometheus-fabric namespace (centralized model) in below example

apiVersion: monitoring.coreos.com/v1
kind: Prometheus
metadata:
  name: fabric-prometheus
  namespace: prometheus-fabric
spec:
  serviceMonitorSelector:
    matchLabels:
      prometheus: fabric
  serviceMonitorNamespaceSelector:
    matchNames:
      - prometheus-fabric  # Only this namespace

Below is the workflow of Dynamic, label-based Discovery of a scrape endpoint:

In below workflow example, prometheus is deployed in prometheus-namespace and the application is deployed in otel-demo.
The workflow shows tying up between :
Promethues –> ServiceMonitor –> Service –> Pods

┌─────────────────────────────────────────────────────────────┐
│ 1. Prometheus (namespace: prometheus-namespace)               │
│                                                             │
│    serviceMonitorSelector:                                  │
│      matchLabels:                                           │
│        prometheus: fabric  ◄────────────────────┐          │
│                                                  │          │
│    serviceMonitorNamespaceSelector: {}          │          │
│    (empty = watch all namespaces)               │          │
└──────────────────────────────────────────────────┼──────────┘
                                                   │
                    ┌──────────────────────────────┘
                    │ Operator watches all namespaces
                    ▼
┌────────────────────────────────────────────────────────────┐
│ 2. ServiceMonitor (namespace: otel-demo)                   │
│                                                            │
│    metadata:                                               │
│      labels:                                               │
│        prometheus: fabric  ◄─────────────────┐             │
│    spec:                                     │             │
│      selector:                               │             │
│        matchLabels:                          │             │
│          app: otel-collector  ◄──────────┐   │             │
└───────────────────────────────────────────┼───┼────────────┘
                                            │   │
                    ┌───────────────────────┘   │
                    │ Selects Services          │
                    ▼                           │
┌────────────────────────────────────────────────────────────┐
│ 3. Service (namespace: otel-demo)                          │
│                                                            │
│    metadata:                                               │
│      labels:                                               │
│        app: otel-collector  ◄────────────────┐             │
│    spec:                                     │             │
│      selector:                               │             │
│        app: otel-collector  ◄────────────┐   │             │
│      ports:                              │   │             │
│        - name: metrics  ◄────────────┐   │   │             │
│          port: 9090                  │   │   │             │
└──────────────────────────────────────┼───┼───┼─────────────┘
                                       │   │   │
                    ┌──────────────────┘   │   │
                    │ Port name match      │   │
                    │                      │   │
                    │  ┌───────────────────┘   │
                    │  │ Selects Pods          │
                    ▼  ▼                       │
┌────────────────────────────────────────────────────────────┐
│ 4. Pod (namespace: otel-demo)                              │
│                                                            │
│    metadata:                                               │
│      labels:                                               │
│        app: otel-collector  ◄────────────────┐             │
│    spec:                                     │             │
│      containers:                             │             │
│        - ports:                              │             │
│            - name: metrics                   │             │
│              containerPort: 9090  ◄──────────┼─────────────┤
└──────────────────────────────────────────────┼─────────────┘
                                               │
                    ┌──────────────────────────┘
                    │ Prometheus scrapes
                    ▼
              GET http://10.0.1.50:9090/metrics

Leader/Follower relationship with Primary/Replicas

In most of distributed datastore systems, there are a lot of techical terms to describe the behavior of the system. While these terms, like, “Leader”, “Follower”, “Replication”, “Consistency”, etc., are widely used and helpful, what I feel missing are the details about internal relationship between these terms.
Analogically, while the map of the field is great, it is also important to understand how the soil, water, and sunlight interact to help the plants grow.

In this blog post, I would like to explore the relationship between “Leader-Follower” and “Primary-Replica” in distributed datastore systems.

  1. Mental model of distributed datastore systems:
  2. Leader-Follower vs Primary-Replica:
    1. When is it safe to say Leader = Primary and Follower = Replica?
    2. When is Leader != Primary and Follower != Replica?
  3. Conclusion:

Mental model of distributed datastore systems:

Lets first build a mental model of distributed datastore systems. In general, distributed datastore systems are designed to store and manage data across multiple nodes or servers. At a very high level, these systems can be grouped into three models:

  • Leader-Follower model
  • Multi-Leader model
  • Leaderless model

As a quick overview:

  • In Leader-Follower model, one node is designated as the “Leader” (or “Primary”) and is responsible for handling all write operations. The other nodes, called “Followers” (or “Replicas”), replicate the data from the Leader and handle read operations. Important thing to note here is, all the writes always go to the Leader.
  • In Multi-Leader model, multiple nodes can act as Leaders and handle write operations. Each Leader replicates its data to other nodes, which can also act as Followers. This model allows for higher availability and fault tolerance, but it can also lead to conflicts if multiple Leaders try to write to the same data simultaneously.
  • In Leaderless model, there is no designated Leader node. Instead, all nodes are equal and can handle both read and write operations. Data is typically replicated across multiple nodes to ensure availability and fault tolerance. This model can be more complex to manage, as it requires mechanisms to handle conflicts and ensure consistency across all nodes.

There are definitely more nuances to each of these models, but for the purpose of this blog post, we will focus on them conceptually.

Leader-Follower vs Primary-Replica:

You will see above that “leader” and “follower” are often used interchangeably with “primary” and “replica”. However, there are some subtle differences between these terms that are important to understand.
Is it safe to say that “Leader” is always “Primary” and “Follower” is always “Replica”? Not necessarily.

  • “Leader” refers to the role of a node in the context of write operations. The Leader is responsible for handling all write requests and coordinating the replication of data to Followers.
  • “Primary” refers to the role of a node in the context of data storage. The Primary is the node that holds the authoritative copy of the data.

When is it safe to say Leader = Primary and Follower = Replica?

To put it more simply, look at it from the lense of “unit of data” handled in the system. In Leader-Follower model (like MongoDB), a single unit of data goes to a single node. If you look at the Leader-Follower cluster like Mongodb, it would look something like below, where there are shards, and each shard has a single Leader (Primary) and multiple Followers (Replicas). The important thing to note here is, “unit of data”, maps to a single node.

So, Leader-Follower systems, generally have a one-to-one relationship between Leader and Primary, and Follower and Replica. The main factor here is that the “unit of data” is mapped to a single node.

When is Leader != Primary and Follower != Replica?

However, in some distributed datastore systems, the relationship between Leader-Follower and Primary-Replica can be more complex. Lets take model of leaderless systems. The idea of leaderless systems is, all the writes don’t have to go to a single node. Now the leaderless systems can still be classified as:

  • Truly leaderless: where writes can go to any node, as in cassandra.
  • Semi leaderless: where writes will go to primary ES shard/ Kafka -partition. Those primaries are spread across nodes (not a single host). Unlike Truely leaderless, writes cannot go to any node. They have to go where Primary of “unit-of-data” exist (shard/partition)

In both these cases, the relationship between Leader-Follower and Primary-Replica can be many-to-many. For example, in Cassandra, a single write operation can be handled by multiple nodes, each of which can act as both a Leader and a Primary for different units of data. Similarly, in Kafka, a single partition can have multiple Leaders and Replicas spread across different nodes.
As shown in the image below for Kafka, a single node can be Leader for one partition (Primary for unit-of-data) and Follower for another partition (Replica for unit-of-data). So, in this case, the “unit of data” is not mapped to a single node.


Conclusion:

The way to understand to digest this in by merging two concepts:

  1. Understand the “unit of data” in the system, and how it maps to nodes
  2. Understand the model of the distributed datastore system (Leader-Follower, Multi-Leader, Leaderless)
  • In Leader-Follower systesms (like Mongodb), the “unit of data” maps to a single node, so Leader = Primary and Follower = Replica.
  • In Leaderless systems (like Cassandra, Kafka), the “unit of data” can be spread across multiple nodes, so Leader != Primary and Follower != Replica.

By understanding these relationships, you can better design and manage distributed datastore systems to meet your specific needs.

Encoding: From the POV of Dataflow paths

When studying Chapter 4 of Designing Data-Intensive Applications (Encoding and Evolution), I quickly encounters a level of granularity that seems mechanical: binary formats, schema evolution, and serialization techniques. Yet behind this technical scaffolding lies something conceptually deeper. Encoding is not merely a process of serialization; it is the very grammar through which distributed systems express and interpret meaning. It is the act that allows a system’s internal thoughts — the data in memory — to be externalized into a communicable form. Without it, a database, an API, or a Kafka stream would be nothing but incomprehensible noise.

But, Why should engineers care about encoding? In distributed systems, encoding preserves meaning as information crosses process boundaries. It ensures independent systems communicate coherently. Poor encoding causes brittle integrations, incompatibilities, and data corruption. Engineers who grasp encoding design for interoperability, evolution, and longevity.

This writeup reframes encoding as a semantic bridge between systems by overlaying it with two mental models: the Dataflow Model, which describes how data traverses through software, and the OSI Model, which explains how those flows are layered and transmitted across networks. When examined together, these frameworks reveal encoding as the connective tissue that binds computation, communication, and storage.

  1. So, What is Encoding ?
  2. The Dataflow Model: Where Encoding Occurs
    1. Application to Database Communication:
    2. Application to Application Communication:
  3. The OSI Model: Layers of Translation
  4. Example : Workflow
  5. Mental Models:
  6. Other Artifacts:

So, What is Encoding ?

All computation deals with data in two representations: the in-memory form, which is rich with pointers, structures, and types meaningful only within a program’s runtime, and the external form (stored on disk / sent over network), which reduces those abstractions into bytes. The act of transforming one into the other is encoding; its inverse, decoding, restores those bytes into something the program can reason about again.

This translation is omnipresent. A database write, an HTTP call, a message on a stream — all are expressions of the same principle: in-memory meaning must be serialized before it can cross a boundary. These boundaries define the seams of distributed systems, and it is at those seams where encoding performs its essential work.

Some of the general encoding formats that are used across programming languages are JSON, XML and the Binary variants of them (BSON, Avro, Thrift, MessagePack etc).
– When an application sends data to DB, the encoded format is generally a Binary Variant (BSON in mongo)
– When service 1 sends data to service2 via an api payload, the data could be encoded as JSON within the request body.


The Dataflow Model: Where Encoding Occurs

From the perspective of a dataflow, encoding appears at every point where one process hands information to another. In modern systems, these flows take three canonical forms:

  1. Application to Database – An application writes structured data into a persistent store. The database driver encodes in-memory objects into a format the database can understand — BSON for MongoDB, Avro for columnar systems, or binary for relational storage.
  2. Application to Application (REST or RPC) – One service communicates with another, encoding its data as JSON or Protobuf over HTTP. The receiver decodes the request body into a native object model.
  3. Application via Message Bus (Kafka or Pub/Sub) – A producer emits a serialized message, often governed by a schema registry, which ensures that consumers can decode it reliably.

In all these flows, encoding happens at the application boundary. Everything beneath — the network stack, the transport layer, even encryption — concerns itself only with delivery, not meaning. As DDIA succinctly puts it: “Meaningful encoding happens at Layer 7.”

With those above details, lets expand a little in detail about two Dataflow paths and see how Encoding happens.
(1) Application to Database
(2) Application to Application

Application to Database Communication:

In the case of application-to-database communication, encoding operates as a translator between the in-memory world of the application and the on-disk structures of the database. When an application issues a write, it first transforms its in-memory representation of data into a database-friendly format through the database driver. The driver is the actual component that handles the encoding process. For instance, when a Python or Java program writes to MongoDB, the driver converts objects into BSON—a binary representation of JSON—before transmitting it over the network to the MongoDB server. When the database returns data, the driver reverses the process by decoding BSON back into language-native objects. This process ensures that the semantics of the data remain consistent even as it moves between memory, wire, and storage.

Encoding at this layer, though often hidden from us, is critical for maintaining schema compatibility between the application’s data model and the database schema. It allows databases to be agnostic of programming language details while providing efficient on-disk representation. Each read or write is therefore an act of translation: from structured programmatic state to persistent binary form, and back.

Mermaid of Encoding Dataflow path : Application –> DB

Application to Application Communication:

When two applications exchange data, encoding ensures that both sides share a consistent understanding of structure and semantics. In HTTP-based systems, Service A (client) serializes data into JSON and sends it as the body of a POST or PUT request. The server (Service B) decodes this payload back into an internal data structure for processing. The HTTP protocol itself is merely the courier—the JSON payload is the encoded meaning riding inside the request. This pattern promotes interoperability because nearly every platform can parse JSON.

  • S1 serializes payload → JSON text (this is the endcoding part)
  • HTTP sends that text as the body request (this is imp part which I missed earlier)
  • S2’s HTTP server framework reads it and parses it into native objects

In contrast, systems employing gRPC communicate using Protocol Buffers, a binary schema-based format. gRPC compiles the shared .proto file into stubs for both client and server, ensuring a strong contract between them. When Service A invokes a method defined in this schema, the gRPC library encodes the message into a compact binary stream, transmits it via HTTP/2, and Service B decodes it according to the same schema. The encoding format—textual JSON for REST or binary Protobuf for gRPC—defines not only the data structure but also the performance characteristics and coupling between services.

The OSI Model: Layers of Translation

If you note in the details of above section, most of the encoding we discuss is at Layer7 (application layer). Hence the protocols that we talk about are all L7 protocols – HTTP, gRPC etc.

With that point as note, I tried to overlay the mental model of OSI Networking model on top of Encoding model, to understand better and stitch them together.

While most of the translation of data during encoding happens at L7, other layers with in OSI model also do their own form of encoding. Each layer wraps the one above it like a nested envelope, performing its own encoding and decoding. But while Layers 1–6 ensure reliable delivery, only Layer 7 encodes meaning. A JSON document or a Protobuf message exists entirely at this level, where software systems express intent and structure.

Layer 7  Application   → HTTP + JSON / gRPC + Protobuf
Layer 6  Presentation  → TLS encryption, UTF‑8 conversion
Layer 5  Session       → Connection management
Layer 4  Transport     → TCP segmentation, reliability
Layer 3  Network       → IP addressing, routing
Layer 2  Data Link     → Frame delivery, MAC addressing
Layer 1  Physical      → Bits on wire, voltage, light

Example : Workflow

With above details, lets try a usecase of encoding between two services, which are taking to each other in a restful way via apis. (s1 and s2)
Lets plot the flow diagram of encoding with OSI model on top of it

Mental Models:

To conclude, below are the mental models to think through, when considering Encoding:

  • Different dataflow patterns (app--> DBapp--> appapp --> kafka --> app)
  • Encoding at different OSI layers (L7 all the way till L1)

Other Artifacts:

When to Emit What O11y Signal?

The intention of this page is to put together the Observability Signal Guidelines which will provide the required visibility into the systems without hurting the cost aspect of the solution.

Three basic observability signals that any application emits are:

  • Metrics,
  • Traces and
  • Logs

The general question is – When to emit what signal?

The answer lies in the intent behind the signal being emitted. What do you intend to measure with the Observability signal that you are emitting?

Below is a rule of thumb which can help answer this.


Rule of thumb:

Metrics:

If you want to measure anything as count , metrics is the best way to do it. Any question that starts as “How many ….” – metrics are a good choice.

  • some example measure could be :
    • number of documents process
    • throughput of an application
    • number of errors
    • kafka lag for a topic

Note: Please be careful of not including high cardinality tags on metrics.

Traces:

If you want to measure anything as an element of time, it should be a trace signal.

  • some examples:
    • end to end time of a document through an app (trace)
    • time taken by a part of transaction (span)
    • anything that needs high cardinality tags

Note: Traces are sampled. But sampling is not a bad thing. With time as a unit of measure in traces/span, trace will show when something is slow, but might miss the peak (max) values by a small margin.

Below Graph shows that sampling will not miss indicating the slowness seen in latencies.

Logs:

If you want to emit signals of high cardinality and don’t want it sampled, logs are your friends. The definition of high cardinality could be documentId, gcid etc, where we are measuring things at the smallest entity.

  • some example:
    • time taken for processing per request-id
    • tracking the flow path of a request with attributes like request-id, attachment types etc.

Logs have a few advantages as observability signals:

  • with custom-sdk (or Otel-sdk), you can emit logs with least boiler plate code.
  • with logs being structured via an sdk, there is scope for building post processors on top of logs
  • AI capabilities are planned on top of logs, if they are emitted via an sdk.

Emitting logs is debug mode for a long duration of time is not the definition of high-cardinality and should be avoided.


Below is a summary table on when to emit what Observability signal:

SignalWhen to use?Retention
MetricOn measuring count signalLong (few months)
TraceOn measuring time signalShort (few weeks)
LogOn measuring high cardinality and non-sampled signalSuper short (few days)

If you notice closely, as the attributes on an O11y-signal increases (tags/metadata associated with a signal), it becomes more useful when getting to know the state of the system. But also, at the same time, it increases the cost of that O11y-signal.
So, it is a natural effect that retention of an O11y-signal decreases as the cardinality of its metadata increase.

This has magically worked well as it doesn’t compromise on context of a O11y-signal (attributes/tags etc), at the same time takes care of cost aspect.

Networking and Protocols: 101 Notes

I recently did a brush up course on Networking/Protocols 101’s. Making my notes public.

  1. Networking Basics / Protocols:
    1. Mental model to think about all protocols:
    2. A few notes about different Protocols:
      1. Network layer protocol:
      2. Transport layer protocol:
        1. TCP:
        2. UDP:
      3. Other Protocols:
        1. HTTP:
        2. SMTP:
        3. XMPP:
        4. MQTT:
  2. AWS Networking:
    1. Local Zone:
    2. Edge location:
    3. Understanding IPv4, IPv6
      1. IPv4
      2. IPv6
      3. Classes IPv4
      4. How to read CIDR noation:
    4. AWS VPC:
      1. Interacting with VPC:
    5. Internet Gateway (IGW)
    6. Subnet:
    7. Route table
    8. NACL:

Networking Basics / Protocols:

There are 7 layers of communications as defined in OSI (Open systems Interconnection) model

LayerNameCore FunctionSignificanceExample ProtocolsMental Hook
7ApplicationInterface for user/applicationEnables end-user apps to use network (browsers, email clients). Application specific formats and logicHTTP, FTP, SMTP, SSH, DNS, XMPP“You (user) start here”
6PresentationData translation, encryption, compressionEnsures data format is understood across systemsSSL/TLS, JPEG, MPEG, ASCII“Translator and decorator”
5SessionStarts, maintains, and ends communication sessionsKeeps track of sessions (chat, video, etc.)NetBIOS, RPC“Conversation manager”
4TransportReliable delivery, error handlingSegments data, reorders, retransmits if neededTCP (reliable), UDP (faster)“FedEx: delivery guarantee or not”
3NetworkLogical addressing and routingMoves packets across networks using IPsIP, ICMP, IPSec, OSPF“GPS: how to get there”
2Data LinkNode-to-node delivery, MAC addressingEnsures data is delivered over a single hop/linkEthernet, ARP, PPP, VLAN“Street address & postman”
1PhysicalBit transmission over physical mediumSends 0s and 1s via electrical/optical/mechanical meansCables, NICs, Hubs, Modems“Wires, Wi-Fi, fiber — raw transport”

Mental model to think about all protocols:

  • Protocols are more like rules/languages two systems agree to communicate in.
  • So there are different protocols like – HTTP / SMTP / UDP / XMPP etc. When we think and relate to OSI model (7 layers), the general question is:

“At what abstraction level does this protocol operate? And does it interact with other layers?”

Each layer in the OSI model has its own type of protocol, and protocols are layered over each other, not isolated. Lower layers support upper layers.
Higher level protocols, sometimes, have hard dependency on lower layer protocols.

For example: XMPP protocol (used in instant messaging) – is a layer 7 protocol and works at Application layer.
But depends on TCP (layer 4) to operate.
It also often uses TLS (layer 6) for encryption.
TCP itself uses IP (layer 3) for routing across network

So XMPP OSI stack is as below:

XMPP (L7)
⬇
TLS (L6) – optional
⬇
TCP (L4) ← hard dependency
⬇
IP (L3)
⬇
Ethernet/Wi-Fi (L2)
⬇
Copper/Fiber (L1)

If TCP blocked, XMPP wouldn’t work.
So yes, a high-level protocol does span multiple layers indirectly but it is classified by its highest-level function.

  • Think of the OSI model as a 7-story building.
  • XMPP/SMTP live on the top floor (L7).
  • They send messages down through elevators (TCP/UDP).
  • Those messages ride the subway (IP) and hop onto the road (Ethernet) to get to the destination.

A few notes about different Protocols:

Network layer protocol:

  • This is at network layer – L3
  • this layer is responsible to delivery the packets from source to destination via IP addresses and routing from source -> destination.

Transport layer protocol:

This is layer4: Breaks the data into segments, adds ports, retransmits if needed. Include TCP / UDP like below:

TCP:

  • retransmit data if failed
  • prefers reliability of communication over the speed/throutput
  • uses three-way handshake process is an agreement between the two parties to send and accept the data
  • Ports:
    • A connection has both a source and a destination port for communication.
    • port is a virtual point managed by an OS that defines an entry to or exit from a software application (numbered from 0 to 65535).
    • You can compare them to your personal computer ports, such as USB ports.
    • The following are the three divisions of range from 0 to 65535:
    • (1) Well-known ports
      • Range from 0 – 1023 Link
      • example: 22- ssh, 80 – http
    • (2) Registered ports
      • Range from 1024 to 49151 Link
      • Used mainly by user processes. Like openvpn – 1194
    • (3) Ephemeral ports
      • Range from 49152 to 65535
      • can be used for private and temporary purpsouses
    • If two communcation are configured to use the same port, there will be a port conflict and second process will not come up.

UDP:

less reliable, but faster

  • used in low latency cases like video call, gaming, telemetry collection like in datadog
  • It is faster because it doesn’t involve a three-way handshake process for establishing a connection, and it provides no guarantee of data delivery, so there is no overhead of retries.

Other Protocols:

HTTP:

  • The world heavily depends on the internet for day-to-day work, and most of this work happens in web browsers and software applications running on mobile devices.
  • Status codes are how you know what happened to a request sent
  • HTTP has evolved, and the version represents which particular specification the application is using. — http1/http2/http3

SMTP:

  • Back in the day:
    • you had own a PC and run a email client on your laptop to send/receive an email
  • This changed with Hotmail in 1996. – with laucnh of free web based email client
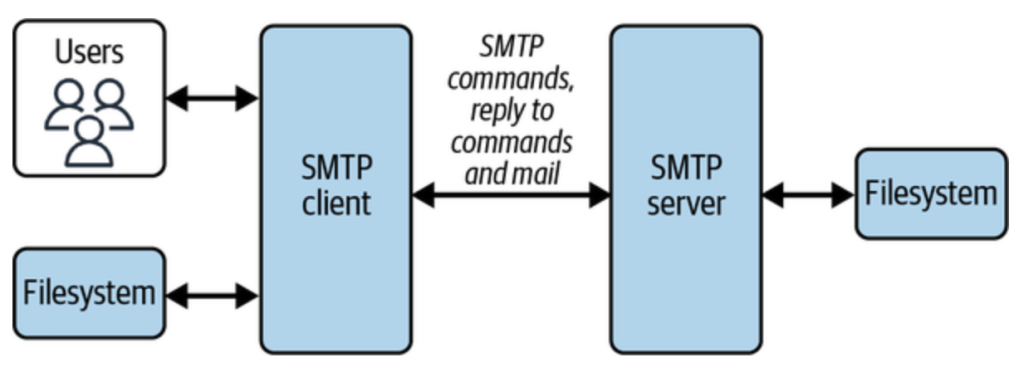
  • SMTP protocol is used for email communication between two / more parties
  • The SMTP client identifies the mail domain (such as gmail.comhotmail.com, etc.) and then establishes a two-way stateful channel to corresponding SMTP server(s).
    • if it is gmail to gmail – then it is same smtp server
    • else it is two different
  • SMTP server can also act as gateway, meaning that further transport of mail is carried out with the help of other protocols, not via SMTP
  • There are two other protocols, that work on pull based mechanism (like your phone pulling messages from SMTP server):
    • Post Office Protocol (POP)
      • POP connects with the email servers, downloads the content to the local machine, and deletes the emails from the server.
      • this makes mails available for offline. and is fast as messages are already local
    • Internet Message Access Protocol (IMAP)
      • IMAP directly reads from servers without downloading content to the local machine or deleting the emails after reading
      • this helps with syncing mails across devices as source isn’t deleted

XMPP:

  • Extensible Messaging and Presence Protocol
  • used mainly in instant messaging services
  • has details of Websocket way of communication.

MQTT:

  • Message Queuing Telemetry Transport
  • MQTT was originally designed for applications to send telemetry data to and from space probes using minimum resources
  • mainly used in IoT devices
  • This is based on pub/sub model – more like kafka
  • Has Different Delivery Semantics: Atmost once, Atleast once, Exactly once.

AWS Networking:

Levels involved in AWS global infra : Region –> Availability zone –> Edge locations –> Local zones –> Wavelength zones

Local Zone:

Characteristics of local zone

FeatureDescription
OwnershipFully provisioned and managed by AWS.
LatencyProvide single-digit millisecond latency to users in specific locations.
Available ServicesCore services like EC2, EBS, ECS, EKS, ALB/NLB, and Direct Connect.
Parent RegionTightly integrated with a parent AWS Region (e.g., us-west-2 for Los Angeles).
Use CasesMedia & entertainment, gaming, real-time analytics, hybrid cloud, healthcare, etc.

Comparison of local zone with a full AWS region:

FactorManaged Region (like Mumbai)Delhi Local Zone
Latency to Delhi Users~40–60ms~5–10ms
Service BreadthFullLimited (mostly EC2/EBS/NLB)
Availability ZonesMulti-AZSingle AZ
CostNo inter-AZ data transferHigher due to parent↔local traffic
Ideal ForScalable, full-service appsLow-latency edge workloads

Edge location:

  • These are mainly AWS content delivery network (CDN) and Edge computing locations.
  • They are fully managed services by AWS and serve as Point of Presence (PoP) for caching, routing and edge computing.
Use CaseDescription
CDNUsed by Amazon CloudFront to cache content close to users, reducing latency.
DNS RoutingRoute 53 uses edge locations to serve low-latency DNS responses.
DDoS ProtectionAWS Shield & WAF operate at the edge to mitigate attacks before traffic hits your backend.
Edge ComputingRun Lambda@Edge functions to execute custom logic close to users (e.g., URL rewrites, auth headers).
Global Load BalancingAWS Global Accelerator leverages edge locations to route user traffic optimally.

Understanding IPv4, IPv6

IPv4

  • supports 32bit number IP address. Represented as dot decimal notation in 4 blocks.
  • 2^32 = 4.2 billion total unique address
  • Note that an IPv4 address has 4 blocks as seen above. Each block gets 8bits – 2^8. So that is 0-255 range. (octate)
  • each ipv4 address can range from 0.0.0.0 to 255.255.255.255
  • but not all ip addresses are available to use.
    • 127.0.0.0/8 – loopback (e.g., 127.0.0.1)
    • 192.168.0.0/16, 10.0.0.0/8, 172.16.0.0/12 – private IPs
    • 0.0.0.0, 255.255.255.255 – special purpose

IPv6

  • 128 bit number represented in 8blocks separated by colon :
  • Total addresses 2^128
  • fe80:8fe0:7113:0000:8990:0000:99bf:3264 is an IPv6 address.
  • each block above gets 16 bits, 2^16 — 0-9,a-f

Classes IPv4

  • An IP address is nothing but an address for a machine to which we could deliver packets.
  • It has two parts to it – network part and host part
  • there are classes in ipv4 as A, B, C, D and E
  • this is mainly based on how many bits are reserved for host and how many reserved for hosts.
ClassStarting Bit(s)Address RangeDefault Subnet MaskHosts per NetworkUse Case
A01.0.0.0 – 126.255.255.255255.0.0.016 millionVery large networks
B10128.0.0.0 – 191.255.255.255255.255.0.065,000Medium-sized networks
C110192.0.0.0 – 223.255.255.255255.255.255.0254Small networks
D1110224.0.0.0 – 239.255.255.255Multicast
E1111240.0.0.0 – 255.255.255.255Experimental
  • This leads to a lot of waste full IPs, if lets say I want only 2 million hosts – there is nothing between A and B classs.
  • So CIDR was introduced and which is widely used today.

How to read CIDR noation:

  • CIDR reading is mainly to know “How many bits are used for the network part and how many bits are used for the host part”.
  • For ipv4, there are total of 32 bits. The /notation indicates how many bits are used for the network part.
  • 192.168.1.0/24 — means 24 bits are for network. (32-24)=8 bits are for Hosts, which is 2^8 = 256 (254, always subtract 2, networkId & broadcastAddress)
CIDRNet BitsHost BitsIPs TotalUsable HostsSubnet Mask
/882416,777,21616,777,214255.0.0.0
/16161665,53665,534255.255.0.0
/24248256254255.255.255.0
/282841614255.255.255.240
/3030242255.255.255.252
/3232010255.255.255.255
  • Subnet Mask above is a way of showing which part of an IP address is the network and which part is the host.
  • CIDR and Subnet Mask complement each other. See how as the CIDR range increases, the IP range in Subnet Mask makes more room for HostIPs.
  • Subnet being 255 in a way represents that those slots are taken up by Network representation of IP and 0 or less than 255 represents Host representation available.

AWS VPC:

  • it is a aws managed service that provides a “software-define” private network. All aws accounts come with a default vpc.
  • all the aws resources are hosted inside the vpc (ec2, rds etc)
  • The default vpc subnets are public
Fact DescriptionValue
Default VPCs per region per account5
Default subnets per VPC per account200
VPC is scoped toAWS Region
Required to create VPCCIDR block
Can VPC be divided into subnets?Yes
Types of VPCsDefault, Nondefault
Default CIDR block for default VPC172.31.0.0/16
Max CIDR block size for VPC/16
Min CIDR block size for VPC/28
Max number of CIDR blocks per VPC5 (can be increased via limit request)
Max number of IPv6 CIDR blocks per VPC1 (associated from AWS pool or BYOIPv6)
Default route table creation with VPCYes
Default security group creation with VPCYes
Default network ACL creation with VPCYes
Can you associate multiple subnets to a VPC?Yes (subnets must be in same region)

Interacting with VPC:

  • aws ec2 describe-vpcs --region us-west-2 — will show all the vpcs and their configs in that region
  • aws ec2 describe-vpcs --region us-west-2 | jq '.Vpcs[].CidrBlockAssociationSet[].CidrBlock — will print the cidr block with each vpc. Play around with jq to get what you want.
  • While above commands will do the grepping after get all the data from the aws, below aws –filters will get only the required data
    • How to get the list of available IPs count per subnet for a vpc
      • change the vpc id in the below command to the one you are interested in
      • the command here is aws ec2 describe-subnets — it is just getting required fields after that

Internet Gateway (IGW)

  • IGW is a vpc component which enables internet communication between instances in a vpc and the internet.
  • Internet gateway is a horizontally scalable, redundant and highly available VPC component.
  • All the subnets (AZ components), if they have to talk to internet, they will have to talk via the same internet gateway, which is setup for the vpc.
    • IGW –> set as target in route table
    • Route table –> attached to a subnet
  • The fact that if a subnet can see an internet gateway or not, depends on the route table that is configured for that subnet.
    • You have VPC: 10.0.0.0/16
    • Subnets:
      • subnet-a (AZ: us-east-1a): 10.0.1.0/24
      • subnet-b (AZ: us-east-1b): 10.0.2.0/24
    • You attach one Internet Gateway to the VPC.
    • You update the route table for subnet-a to include below. But subnet-b doesn’t have any route to igw.
    • So only subnet-a can talk to internet gateway setup on the vpc
  • Internet Gateway has two primary responsibilities
    • (1) It provides a target in route table for internet routable traffic
      • A subnet does not allow outbound traffic by default. Your VPC uses route tables to determine where to route traffic.
      • To allow your VPC to route internet traffic, you create an outbound route in your route table with an internet gateway as a target, or destination.
      • more in the Route Table section below
    • (2) It protects ip addresses on network by performing Network Address Translation
      • Resources on your network that connect to the internet should use two kinds of IP addresses:
      • Private IP: Use private IPs for communication within your private network. These addresses are not reachable over the internet.
      • Public IP: Use public IP addresses for communication between resources in your VPC and the internet. A public IP address is reachable over the internet.
        • You can either configure your VPC to automatically assign public IPv4 addresses to your instances, or you can assign Elastic IP addresses(more on elastic ips – here) to your instances. Your instance is only aware of the private (internal) IP address space defined within the VPC and subnet.
        • The internet gateway logically provides the one-to-one NAT on behalf of your instance, so that when traffic leaves your VPC subnet and goes to the internet, the reply address field is set to the public IPv4 address or Elastic IP address of your instance, and not its private IP address. Conversely, traffic that’s destined for the public IPv4 address or Elastic IP address of your instance has its destination address translated into the instance’s private IPv4 address before the traffic is delivered to the VPC.

Docs – https://docs.aws.amazon.com/vpc/latest/userguide/VPC_Internet_Gateway.html

Subnet:

  • A subnet is a small subset of your Ip addresses from a vpc. You can launch any AWS resource inside a subnet.
  • It is a way of splitting larger network into many small subnetworks. This mainly done using CIDR.
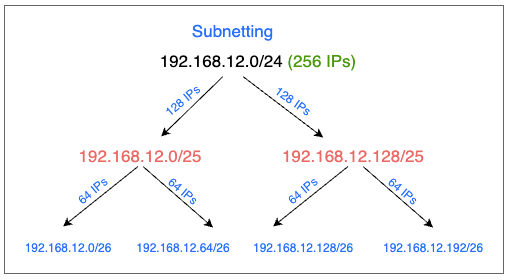
  • Example: if we have a network with 256 host ips which we want to split into subnets of 64 ips each, this is how you will do it
CIDR BlockTotal IPsIP Range
192.168.12.0/24256192.168.12.0 – 192.168.12.255
├─ 192.168.12.0/25128192.168.12.0 – 192.168.12.127
│ ├─ 192.168.12.0/2664192.168.12.0 – 192.168.12.63
│ └─ 192.168.12.64/2664192.168.12.64 – 192.168.12.127
└─ 192.168.12.128/25128192.168.12.128 – 192.168.12.255
├─ 192.168.12.128/2664192.168.12.128 – 192.168.12.191
└─ 192.168.12.192/2664192.168.12.192 – 192.168.12.255
  • Mental model to find the ip range for a cidr givens
    • subtract the /notation from 32 — that is your host ips total available
    • start with given ip starting point and add those many above (total value – 1)
  • Subnets can be either public or private. A public subnet if the resource in it has to connect to the internet, else it will be a private subnet.

There are other things covered like:

  • Types of subnets – public / private
  • Connection to internet for private subnet via NAT gateway

Route table

  • Route table is a set of rules (routes) that are used to determine network traffic from a subnet.
  • When a vpc is created, a main route table is also created(shown in first image). This will initially just have one single local route. This will enable traffic across resources within the vpc.
  • You cannot modify local route in the route table.
  • Each subnet must be associated with a route table. If not explicitly associated, the subnet will implicitly associate with main route table.
  • A subnet can be associated with only one route table at a time, but a same route table can be associated with many subnets.
    • subnet : route table :: one to one
    • route table : subnet :: one to many
  • In above image(Route Tables), you see that:
    • public subnet is linked to a route table which has a route for IGW (internet gateway), so that resources in the public subnet can talk to internet
    • private subnet has a route table which doesn’t have a route to IGW. So no resource in it can talk to internet directly.

NACL:

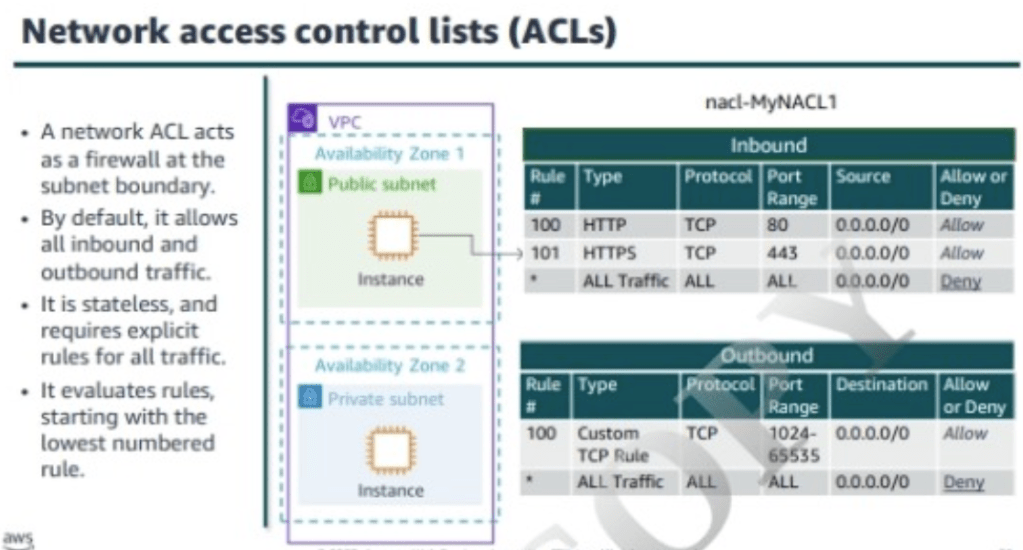
  • NACL is an optional layer of security for vpc that acts as firewall for controlling traffic in and out of one or more subnets.
  • vpc comes with a default NACL, which will allow all inbound and outbound IPv4 traffic.
  • on creating and assigning a custom nacl, it by default denies all the inbound and outbound traffic.
  • Nacl are stateless, which means there need to be explicit inbound and outbound rules set to allow or deny traffic.

This is just a dump of all notes for self reference later.

Enhancing Observability with OTel Custom Processors

Observability is crucial for modern distributed systems, enabling engineers to monitor, debug, and optimize their applications effectively. OpenTelemetry (Otel) has emerged as a comprehensive, vendor-neutral observability framework for collecting, processing, and exporting telemetry data such as traces, metrics, and logs.

This blog post will explore how custom processors in OpenTelemetry can significantly enhance your observability strategy, making it highly customizable and powerful.

The repo link where I have implemented a very simple Otel-Custom-Processor.
https://github.com/AkshayD110/otel-custom-processor/tree/master

Quick Introduction to OpenTelemetry (Otel)

OpenTelemetry simplifies observability by providing a unified approach to collect, manage, and export telemetry data. By standardizing telemetry practices, it bridges the gap between applications and observability tools, making it easier to understand complex systems.

Core OpenTelemetry Components

OpenTelemetry mainly comprises:

  • Exporters: Send processed telemetry data to monitoring and analysis systems.
  • Collectors: Responsible for receiving, processing, and exporting telemetry.
  • Processors: Offer the ability to manipulate, filter, and enrich telemetry data between receiving and exporting.
  • SDKs: Libraries to instrument applications and produce telemetry.

Refer to the official OpenTelemetry documentation for more details.

Building a Custom Processor with OpenTelemetry

Custom processors are powerful because they allow you to tailor telemetry data processing exactly to your needs. The simplicity of creating custom processors is demonstrated in this custom processor GitHub repository.

This repository demonstrates building a simple metrics processor that implements the Otel processor interface. Specifically, the provided example logs incoming metrics to the console, illustrating how straightforward it is to start building custom logic.

Here’s the essential snippet from the repo:

func (cp *CustomProcessor) ConsumeMetrics(ctx context.Context, md pdata.Metrics) error {
	// Example logic: printing metrics
	return cp.next.ConsumeMetrics(ctx, md)
}

You can review the detailed implementation here.

This example serves as a foundational step, but you can easily enhance it with more complex functionality, which we’ll discuss shortly.

Integrating Your Custom Processor into OpenTelemetry Collector

Integrating your custom processor involves a few straightforward steps:

  1. Clone the OpenTelemetry Collector Contrib repository.
  2. Update the go.mod file to reference your custom processor package.
  3. Register your processor within the collector configuration.
  4. Rebuild the collector binary (e.g., using make build).
  5. Create a Docker image that includes your custom collector.

Note that you have to build the custom processor along with other otel components, but not individually and independently. They all work well together.

Practical Uses of Custom OpenTelemetry Processors

Beyond simple logging of metrics show above, custom processors unlock numerous powerful use cases. Here are some practical examples:

1. Metric Filtering

Filter telemetry data selectively based on criteria like metric names, threshold values, or specific attributes, helping reduce noise and operational costs. You get to control what goes to the Observability backend.

2. Metric Transformation

Transform metrics to standardize data units or restructure attributes, making your monitoring data consistent and meaningful.

3. Aggregation

Aggregate metrics across various dimensions or intervals, such as calculating averages or rates, to generate insightful summaries.

4. Enrichment

Augment metrics with additional metadata or context, aiding quicker diagnosis and richer analysis. Add the groupnames and tags.

5. Alerting

Embed basic alerting logic directly into your processor, enabling rapid response when thresholds are breached.

6. Routing

Route specific metrics to distinct processing pipelines or different monitoring backends based on defined attributes, enhancing management and optimization.

7. Caching

Cache telemetry data temporarily to enable sophisticated analytical operations like trend analysis or anomaly detection. Can be further extended to build a Transformation layer.


Conclusion:

OpenTelemetry custom processors offer exceptional flexibility, enabling personalized and efficient telemetry management. By incorporating custom logic tailored to your specific needs, you unlock deeper insights and enhance your overall observability.

Explore the custom processor repository today and start customizing your observability strategy!

Resources and references:

Memory management : Java containers on K8s

This page documents a few aspects of memory management on Java containers on K8s clusters.

For java containers, memory management on K8s have various factors:

  • Xmx and Xms limits managed by java
  • Request/limit values for the container
  • HPA policies used for scaling the number of pods

Misconfigurations / misunderstanding of any of these parameters leads to OOMs of java containers on K8s clusters.

Memory management on java containers:

  • -XX:+UseContainerSupport is enabled by default form java 10+
  • -XX:MaxRAMPercentage is the jvm parameter that specifies the percentage value of limits memory defined on the container, that can be used by heapspace. Default value is 25%.
  • Example: if -XX:MaxRAMPercentage=75, and container memory limit is 3GB, then:
  • -Xmx=75% of 3GB = 2.25GB
  • Important point to note: MaxRAMPercentage is calculated on limits and not requests

K8s : requests/limits:

  • as shown above, the memory assignment for the container is based on the values set for limits configuration
  • However, for hpa to kick-in, requests is used for Kubernetes.
  • Example:
    • If you configure HPA for memory utilization at 70%, it calculates usage as:
    • Memory Usage % = (Current Usage / Requests) * 100
    • (1.8GB / 2GB) * 100 = 90% – results in hpa kicking-in
    • scaling would happen usage wrt request configuration
  • If requests.memory is set low (2GB) and limits.memory is high (3GB), HPA may scale aggressively because it calculates usage based on requests, not limits.
  • The only advantage of setting limit > request – is : if non-heap space growth increases, it will not crash the vm. That’s one of a case with less probability compare to heap space crash.

Ideally, to make things simpler, based on the historic usage of the application – set “request=limits” for memory usage on java container. This will simplify the Xmx, request, limits and hpa math.

For scaling apps, there is alway HPA which can increase instances based on usage.


Conclusion

  • for java containers on K8s, know the memory needs of your app and set “request=limits”
  • use hpa for scaling and not depend on “limits>request” for memory
  • containers: run them small and run them many (via scaling based on rules)

Message delivery in Distributed Systems

In distributed systems, the principle of message passing between nodes is a core concept. But this leads to an inevitable question: How can we ensure that a message was successfully delivered to its destination?

To address this, there are three types of delivery semantics commonly employed:

At Most Once

At Least Once

Exactly Once

Each of these offers different guarantees and trade-offs when it comes to message delivery. Let’s break down each one:

1. At Most Once

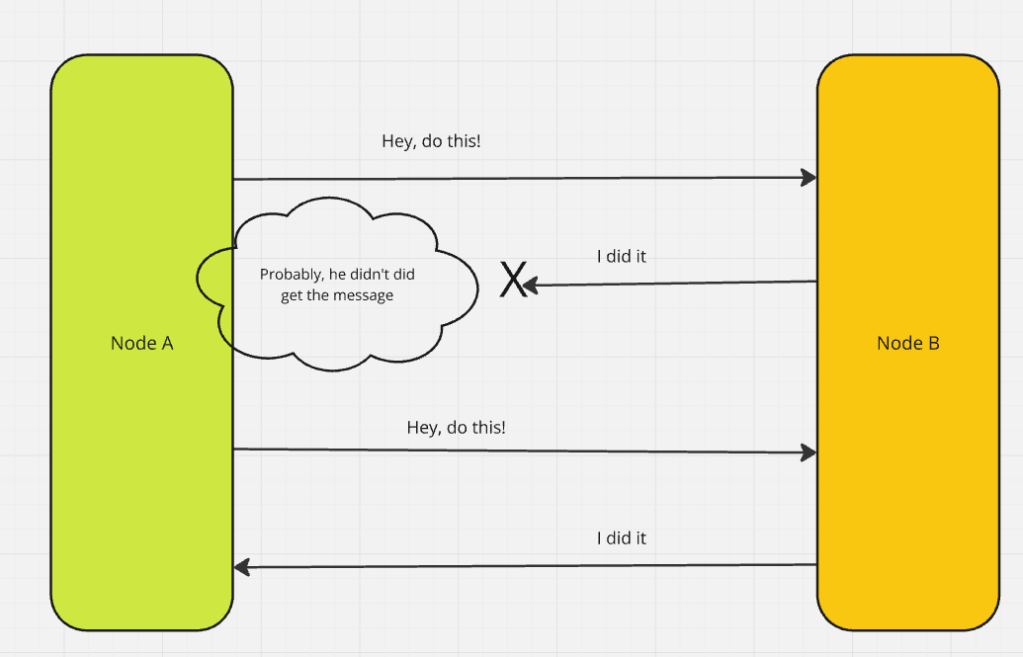
This semantic guarantees that a message will be delivered at most once, without retries in case of failure. The risk? Potential data loss. If the message fails to reach its destination, it’s not retried.

2. At Least Once

Here, the message is guaranteed to be delivered at least once. However, retries are possible in case of failure, which can lead to duplicate messages. The system must be designed to handle such duplicates.

3. Exactly Once

This ideal semantic ensures that the message is delivered exactly once. No duplicates, no data loss. While it’s the most reliable, it’s also the most complex to implement, as the system must track and manage message states carefully.


Achieving the Desired Delivery Semantics

To ensure these semantics are adhered to, we rely on specific approaches. Let’s examine two of the most important ones:

Idempotent Operations Approach

Idempotency ensures that even if a message is delivered multiple times, the result remains unchanged. A simple example is adding a value to a set. Regardless of how many times the message is received, the set will contain the same value.

This approach works well as long as no other operations interfere with the data. If, for example, a value can be removed from the set, idempotency may fail when a retry re-adds the value, altering the result.

Idempotency runs more close to the philosophy of stateless. Each message is treated independently without caring if it is different or same. If the signature of the message is the same, it will generate the same output.

Deduplication Approach

When idempotency isn’t an option, deduplication can help. By assigning a unique identifier to each message, the receiver can track and ignore duplicates. If a message is retried, it will carry the same ID, and the receiver can check whether it has already been processed.

Deduplication generally requires aggressive state tracking, checking on the requestId(from db or cache) before processing every item. The focus at implementation is that, the duplicate messages don’t reach the processing state at all.

However, there are several challenges to consider:

• How and where to store message IDs (often in a database)

• How long to store the IDs to account for retries

• Handling crashes: What happens if the receiver loses track of message IDs during a failure?

My Preference: Idempotent Systems

In my experience, idempotent systems are simpler and less complex than deduplication-based approaches. Idempotency avoids the need to track messages and is easier to scale, making it the preferred choice for most systems, unless the application logic specifically demands something more complex.

Exactly Once Semantics: Delivery vs. Processing

When we talk about “exactly once” semantics, we need to distinguish between delivery and processing:

Delivery: Ensuring that the message arrives at the destination node at the hardware level.

Processing: Ensuring the message is processed exactly once at the software level, without reprocessing due to retries.

Understanding this distinction is essential when designing systems, as different types of nodes—compute vs. storage—may require different approaches to achieve “exactly once” semantics.

Delivery Semantics by Node Type

The role of the node often determines which semantics to prioritize:

Compute Nodes: For these nodes, processing semantics are crucial. We want to ensure that the message is processed only once, even if it arrives multiple times.

Storage Nodes: For storage systems, delivery semantics are more important. It’s critical that the message is stored once and only once, especially when dealing with large amounts of data.


In distributed system design, the delivery semantics of a message are critical. Deciding between “at most once,” “at least once,” or “exactly once” delivery semantics depends on your application’s needs. Idempotent operations and deduplication offer solutions to the challenges of message retries, each with its own trade-offs.

Ultimately, simplicity should be prioritized where possible. Idempotent systems are generally the easiest to manage and scale, while more complex systems can leverage deduplication or exactly once semantics when necessary.