[Tiny tool]: Book Extract Reminders

There is no better pleasure than the Joy of solving your own problems.

This write up is not to show off coding skill(there is hardly any code in this tool), but to show the ease with which anyone can build tools to solve problems these days.

Problem statement:

How to retain the most out of the books we read? Maybe receiving daily reminders with extracts from the books?

I consume books mainly in the digital format(via kindle/calibre). I have a lot of highlights in these books which I want to be periodically reminded about. I felt, if I take out 6hours in reading a book, and completely forget all learnings in next 6months, then that’s not efficient.

Solution:

So the idea was, build something that:

  • takes all my highlights from the kindle/calibre (currently manual – to be automated)
  • pull these highlights in to git
  • python tool, that randomly pick 10(configurable) highlights
  • mails them to gmail using smtplib.
  • automate the workflow via github action to run daily at a specified time.

The code is available for anyone to take a look at here on git. Kindly go through README file for more details.

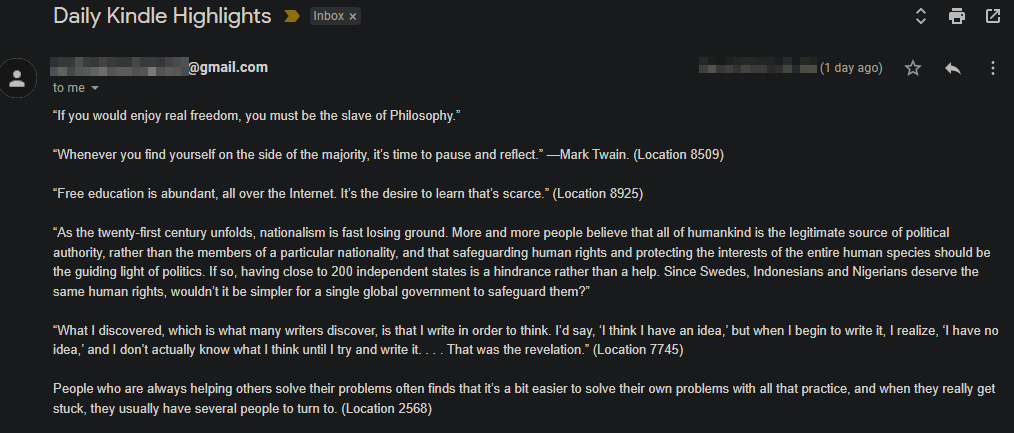
Below is the mail format that is sent daily(7am) with the extracts from the books that I have read and highlighted.


A few things:

  • If you wish to receive these mails as well, cut the PR here, with your mail id. If you are not comfortable sharing mail-id on git, mail me(akshaydeshpande1@acm.org), I will add you in to a gitingnore file.
  • Feel free to fork the repo and run it with your quotes/highlights from your books [MIT licensed].
  • If you mainly consume books as hard copies, then you can use Google Lens to get the text out of your books and add it to git.

Open for any ideas / suggestions.

Weekly Bullet #32 – Summary for the week

Here are a bunch of Technical / Non-Technical topics that I came across recently and found them very resourceful.

Technical :

  • Memory leaks on client side – the forgotten side of web performance. Link
  • A list of helpful patterns/commands on "sed" command – link
  • A “Streaming availability” api to lookup which show/movie is available in which OTT in 60+countries. Something to explore for a fun weekend project – link
  • You remember the times, when there are 10 terminal sessions opened on your system and you wanted to know “at what time did I run that command” ? Ya, article addresses the same problem – link
    PS: If you use zsh, there a few themes which come in-built with this feature.
  • Wordle puzzles are crazy popular in the last week or so. Here is a python project to solve the puzzles. link

Non-Technical :

  • Completing part-time master’s in CS while on a full time job! This article was so inspiring also reminds, how much time we waste in general. – link
  • Drop a raindrop anywhere in the world and watch where it ends up. A fun site – link
  • Rocket engines, they deal with a lot of heat right? How come they don’t melt? Detailed geeky explanation – here
  • An interesting Thread on Human psychology fact. link
  • [Image below]: “Stop focusing on the black lines behind you. Start focusing on all of the green lines before you.”
SOURCE: Twitter
  • Extract from a book:

“When you worry, ask yourself, ‘What am I choosing to not see right now?’ What important things are you missing because you chose worry over introspection, alertness or wisdom?”

The Obstacle in the Way, Ryan Holiday

Have a great week ahead!

Weekly Bullet #31 – Summary for the week

Here are a bunch of Technical / Non-Technical topics that I came across recently and found them very resourceful.

Technical :

Source: Unknown

Non-Technical :

  • Naval Ravikant is a great thinker who makes you wonder on different thought processes. His reading recommendations here
  • Lessons from my PhD” – Not only on the PhD topic but in general by Prof. Austin.
  • If— a wonderful poem by Rudyard Kipling here
  • Although, this article is not very engaging in anyways, but the simplicity of it made me fall in love with cycling again. — “Cycling to work
  • We all know the Nobel laureate Richard Feynman for his unique way of thinking(example) but here are some Heart-Wrenching Letters from him to his late wife, Arline.
  • Unless you were living under a rock, you know about James Webb Telescope launched by NASA on Dec 25th. It is fully deployed now. Here is a great comment explaining why it is a Big Deal. A video here.
  • Extract from a book:

“When you are not practicing, remember, someone somewhere is practicing. And when you meet them, they will win.”

Ed Macauley

Happy and Peaceful 2022 !

Weekly Bullet #30 – Summary for the week

Here are a bunch of Technical / Non-Technical topics that I came across recently and found them very resourceful.

Technical :

  • P99 CONF (centered around low-latency, high-performance design) recordings are available here

Non-Technical :

  • Traveling(rather walking) without money! Although old(1998) event, still shows world is not that bad of a place. Link “MY PENNILESS JOURNEY
  • There was this mega-thread on twitter for “one book that changed the way you see the world”. – The consolidated list from the thread on BooksChatter here.
  • Matthew McConaughey addressing University of Houston outgoing students — “5 Rules for the life” (Rule #1 is my fav)
  • Extract from a book:

“If you think about the biographies you read or the documentaries you watch about the greats in various fields, this same pattern of Addictive, Passionate behavior surfaces. Jazz saxophone great John Coltrane reportedly practiced so much that his lips would bleed.”

The Passionate Programmer

Have a great week!

Weekly Bullet #29 – Summary for the week

Here are a bunch of Technical / Non-Technical topics that I came across recently and found them very resourceful.

Technical :

  • eBPF Summit is live now – Recording of the Keynote and live summit here
  • Conference talk – USENIX LISA2021 Computing Performance: On the Horizon by Brendan Gregg – here
  • A project for visualizing codebase – here
  • Self healing systems – the real end goal of observability – here
  • Python3 – Reverse Engineering Tips – here

Non-Technical :

  • Great article on – “How to think: The skill you’ve never been taught” – here
  • An addictive trading game in your browser – Paper trade – here
  • People no longer trust each other. Why? And how can we fix it? An interactive guide to the game theory of trust – here
  • What tiny purchases have disproportionately improved your life? – Thread link
  • Extract from a book:

“But we had two choices,” I said. “Throw our hands up in frustration and do nothing, or figure out how to most effectively operate within the constraints required of us. We chose the latter.

Extreme Ownership by Jocko Willink;Leif Babin

[Performance] : Understanding CPU Time

As a Performance Engineer, time and again you will come across a situation where you want to profile CPU of a system. The reasons might be many; like, CPU usage being high, you want to trace a method to see its CPU cost or you suspect CPU times for a slow transaction.

You might use one of the various profilers out there to do this. (I use yourkit and Jprofiler). All these profilers report the CPU costs in terms of CPU Time, when you profile the CPU. This time is not the equivalent of your watch time.

So in this article, let’s try and understand what is CPU time and other fundamentals w.r.t to CPU.

Clock Cycle of CPU :

The speed of a CPU is determined by its clock cycle, which is the amount of time taken for one complete oscillation of a CPU. (which is two pulses of an oscillation). In more simple terms, consider your CPU like a pendulum. It has to go through it’s 0’s and 1’s, i.e, rising edge and falling edge. The amount of time taken for this one oscillation is the Clock Cycle of a CPU. Each CPU instruction might take one or more CPU cycles to execute.

Clock speed (or Clock rate):

This is the total number of Clock cycles that a CPU can perform in one second. Each CPU executes at a particular clock rate. In fact, Clock speed is often marketed as the primary capacity feature of a processor. A 4GHz CPU can perform 4 billion Clock Cycles per second.

Some processors are able to vary their clock rates. Increase it to improve performance or decrease it to reduce power consumption.

Cycles per instruction (CPI) :

As we know, all the requests are served by CPU in the form of instruction sets. A single request can translated in to 100’s of instruction sets. Cycles spent per instruction is an important parameter which helps understand where CPU is spending its clock cycles. This metrics can also be expressed in the inverse form, i.e, Instructions per Cycle (IPC).

It is important to note that CPI value signifies the efficiency of instruction processing , but not of the instructions themselves.

CPU Time :

After knowing the above parameters, it is much easier to understand CPU time for a program now.

A single program will have a set of Instructions. (Instructions / Program)
Each instruction will consume a set of CPU cycles. ( Cycles / Instruction )
Each CPU cycle is based on the CPU’s clock speed ( secs / cycle)

Hence, the CPU time that you see in your profiler is :

CPU Time for a process = (No. of instructions executed) X (Cycles per Instruction) X Clock Cycle.

So the next time when you see “Time” being mentioned in your Profiler, remember the above calculations.
Happy tuning.

Weekly Bullet #28 – Summary for the week

Here are a bunch of Technical / Non-Technical topics that I came across recently and found them very resourceful.

Technical :

  • All recording from PyCon US 2021 are up on Youtube here. My fav is Keynote by Robert Erdmann about rebuilding 5 µm resolution picture of Rembrandt’s painting “The Night Watch” from 18th century with Python.
Rembrandt’s painting “The Night Watch” from 18th century
  • “Docker For The Absolute Beginner” course. This is offered free on kodekloud.com . The same course was taken by over 97,000 students on Udemy.
  • datefinder is an amazing python module for location date out of different date formats in a string. Here is a short video about the same.
  • Book recommendation – “BPF Performance Tools” – By Brendan Gregg.
    BPF-based performance tools give you unprecedented visibility into systems and applications, so you can optimize performance, troubleshoot code, strengthen security, and reduce costs.

Non-Technical :

  • “How to work Hard” – link here
  • Ironic to the above article — “Always be quitting” – ideas here
  • Language learning with Netflix – chrome extension here
  • Extract from a book :

You never want a serious crisis to go to waste. Things that we had postponed for too long, that were long-term, are now immediate and must be dealt with. [A] crisis provides the opportunity for us to do things that you could not do before.

The Obstacle in the way – Ryan Holiday

Elastic Search Best practices

These are the self-notes from managing 100+ node ES cluster, reading through various resources and a lot of production incidents due to unhealthy ES.

Memory

  • Always choose ES_HEAP_SIZE 50% of the total available memory. Sorting and aggregations both can be memory hungry, so enough heap space to accommodate these is required. This property is set inside the /etc/init.d/elasticsearch file.
  • A machine with 64 GB of RAM is ideal; however, 32 GB and 16 GB machines are also common. Less than 8 GB tends to be counterproductive (you end up needing smaller machines), and greater than 64 GB has problems in pointer compression.

CPU

  • Choose a modern processor with multiple cores. If you need to choose between faster CPUs or more cores, choose more cores. The extra concurrency that multiple cores offer will far outweigh a slightly faster clock speed. The number of threads is dependent on the number of cores. The more cores you have, the more threads you get for indexing, searching, merging, bulk, or other operations.

Disks

  • If you can afford SSDs, they are far superior to any spinning media. SSD-backed nodes see boosts in both querying and indexing performance.
  • Avoid network-attached storage (NAS) to store data.

Network

  • The faster the network you have, the more performance you will get in a distributed system. Low latency helps to ensure that nodes communicate easily, while a high bandwidth helps in shard movement and recovery.
  • Avoid clusters that span multiple data centers even if the data centers are collocated in close proximity. Definitely avoid clusters that span large geographic distances.

General consideration

  • It is better to prefer medium-to-large boxes. Avoid small machines because you don’t want to manage a cluster with a thousand nodes, and the overhead of simply running Elasticsearch is more apparent on such small boxes.
  • Always use a Java version greater than JDK1.7 Update 55 from Oracle and avoid using Open JDK.
  • A master node does not require much resources. In a cluster with 2 Terabytes of data having 100s of indexes, 2 GB of RAM, 1 Core CPU, and 10 GB of disk space is good enough for the master nodes. In the same scenario, the client nodes with 8 GB of RAM each and 2 Core CPUs is a very good configuration to handle millions of requests. The configuration of data nodes is completely dependent on the speed of indexing, the type of queries, and aggregations. However, they usually need very high configurations such as 64 GB of RAM and 8 Core CPUs.

Some other important configuration changes

  • Assign Names: Assign the cluster name and node name.
  • Assign Paths: Assign the log path and data path.
  • Recovery Settings: Avoid shard shuffles during recovery. The recovery throttling section should be tweaked in large clusters only; otherwise, it comes with very good defaults.
    Disable the deletion of all the indices by a single command:
    action.disable_delete_all_indices: false
  • Ensure by setting the following property that you do not run more than one Elasticsearch instance from a single installation:
    max_local_storage_nodes: “1”
    Disable HTTP requests on all the data and master nodes in the following way:
    http.enabled: false
  • Plugins installations: Always prefer to install the compatible plugin version according to the Elasticsearch version you are using and after the installation of the plugin, do not forget to restart the node.
  • Avoid storing Marvel indexes in the production cluster.
  • Clear the cache if the heap fills up when the node start-up and shards refuse to get initialized after going into red state This can be done by executing the following command:
  • To clear the cache of the complete cluster:
    curl -XPOST ‘http://localhost:9200/_cache/clear
  • To clear the cache of a single index:
    curl -XPOST ‘http://localhost:9200/index_name/_cache/clear
  • Use routing wherever beneficial for faster indexing and querying.

[Performance] : What does CPU% usage tell us ?

When you come across a system which is misbehaving, majority of the times the first metrics that we look at is CPU usage. But do we really understand what CPU usage of a system tells us ? In this article let us try and understand what X % usage of a system really means.

One of the easy ways to check on CPU is “top” command.

The “%Cpu(s)” metrics seen above is a combination of different components.

  • us – Time spent in user space
  • sy – Time spent in kernel space
  • ni – Time spent running niced user processes (User defined priority)
  • id – Time spent in idle operations
  • wa – Time spent on waiting on IO peripherals (eg. disk)
  • hi – Time spent handling hardware interrupt routines. (Whenever a peripheral unit want attention form the CPU, it literally pulls a line, to signal the CPU to service it)
  • si – Time spent handling software interrupt routines. (a piece of code, calls an interrupt routine…)
  • st – Time spent on involuntary waits by virtual cpu while hypervisor is servicing another processor (stolen from a virtual machine)

 Out of all the breakdowns above, we usually concentrate mainly on User Time (us) , System time(sy) and IO wait time (wa). User time is the percentage of time the CPU is executing the application code and System time is the percentage of time the CPU is executing the kernel code. It is important to note that System time is related to application time; if application performs IO for example, the kernel will execute the code to read file from disk. Also, any wait seen in IO will reflect in IO wait time. So us%, sy% and wa % are related.

 Now let’s see if we understand this correctly on a whole.

My goal as a Performance Engineer would be to drive the CPU usage as high as possible for as short a time as possible. Does that sound far away from the “best-practice” ? Wait, hold your thought there.

The first thing to know is, the CPU usage reported by any command is always an average over an interval of time. If the CPU consumed by an application is 30% for 10minutes, the code can be tuned to make it consume 60% for 5minutes. Do you see what I mean by “driving the CPU as high as possible for as short time as possible”? This is doubling the performance. Did the CPU usage increase ? Sure, Yes. But is that a bad thing ? No. CPU is sitting there waiting to be used. Use it, improve the performance. High CPU usage is not a bad thing all the time. It may just mean that your system is used at its full potential. A good ROI. However, if you have your run-queue length increasing, where requests are waiting for cpu, then it definitely needs your attention.

In linux systems, the number of threads that are able to run (i.e, not blocked on IO or sleeping etc) are referred to as run-queue. You can check this by running “vmstat 1” command. The first number in each line refers to run-queue.

If the count of the threads in the above output is more than the available CPU’s (count in hyper-threading if enabled), that means the threads are waiting for CPU and the performance will be less the optimal. Although a higher number is ok for a brief amount of time, but if the run-queue length is high for a significant amount of time, it is an indication that system is overloaded.

Conclusion :

  • High CPU usage of a system is not a bad sign all the time. CPU is available to be used. Use it and improve the performance of the running application.
  • If run-queue length is high for a significant amount of time, that mean the system is overloaded, and needs optimizations.

Weekly Bullet #27 – Summary for the week

Here are a bunch of Technical / Non-Technical topics that I came across recently and found them very resourceful.

Technical :

  • Different states of Java Threads and their transitions. – Link
  • A quick look into Sorting in python – RealPython site link (3mins)
  • DevOps in one picture:
  • A cheat sheet to “When to use which collection in java” – here
source: http://www.sergiy.ca
  • A great talk on internals of List and Tuple in Python – YouTube (28mins)

Non-Technical :

  • A crisp explanation on Manager vs Director vs VP – link
TL;DR – Summary from resource link
  • How to learn complex things quickly – Link
  • Bayes’ Theorem and its trap. An intriguing play of numbers – YouTube link (10mins)
  • Extract from a book (a rather long one) :

Imagine that you are having an out-of-body experience, observing yourself on an operating table while a surgeon performs open heart surgery on you. That surgeon is trying to save your life, but time is limited so he is operating under a deadline—a literal deadline.

How do you want that doctor to behave? Do you want him to appear calm and collected?

Or do you want him sweating and swearing?
Do you want him behaving like a professional, or like a “typical developer”?

The Clean Coder by Robert C. Martin