[Performance] : Flame Graphs

In the previous article we explored the basic capabilities of linux Perf_tool.
In this write-up I am trying to extend these capabilities and show how to generate and read Flame Graphs for analyzing the profiles generated with Perf_tool.

How to generate Flame Graphs ?

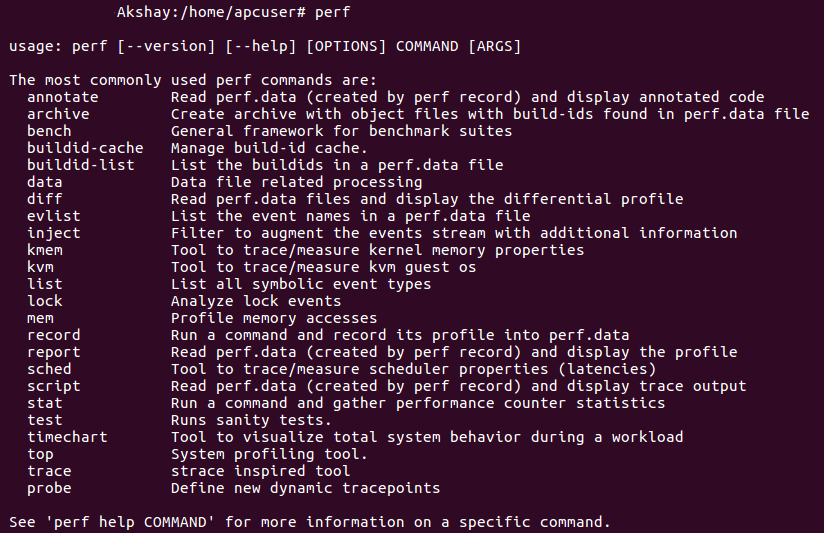
  • To start with, we will need perf_tools linux profiler to capture the profile first. Follow the steps under “How to setup perf tool?” in the previous article.
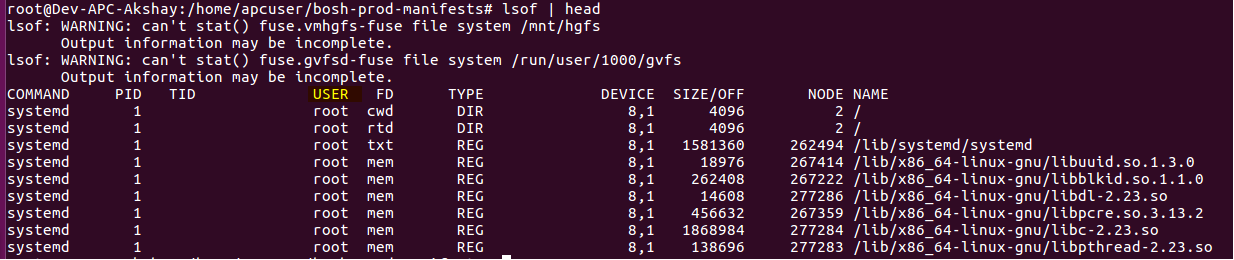
  • Now if you collect a profile of the CPU using perf_tool setup in the above step, there is a possibility that you might see a lot of symbol link values in the place of Function names.
  • To avoid this and keep the names of functions for the corresponding Symbol links resolved before hand, clone the below repository on the machine which you want to profile and follow below steps.
* git clone https://github.com/jvm-profiling-tools/perf-map-agent.git
* Navigate to installation directory where there is "CMakeLists.txt" in the above repo
* run " cmake ."
* run "make"
* Navigate to the directory /perf-map-agent/bin in the above repository
* run "./create-java-perf-map.sh <pid>" --> where <pid> is the processId of the process you want to profile
* This will generate a "perf-<pid>.map" file in /tmp -- this will be used for resolving all the symbol links
  • Clone the Flame Graph dependencies from the below repository.
    git clone https://github.com/brendangregg/FlameGraph
  • Alright, almost there! Now lets collect the CPU profile for the process which we want to investigate.
    Note : More details about the below command and the capabilities of perf_tool in the previous article.
perf record -F 99 -ag -p PID-- sleep 60
  • Now lets generate a flame graph out of the profile collected.
#Copy the perf.data file generated from the profiler in the above step
perf script | ./stackcollapse.pl > outperf-folded
./flamegraph.pl outperf-folded > flameGraph.svg
  • And open the flameGraph.svg in one of the browsers.

How to read a Flame Graph ?

  • Now that we have successfully generated the flame graphs, lets see how we can use it for analysis.
  • Flame Graphs are read bottoms up, just like a Thread dump.
  • If you use the parameter "--color=java” while generating the FlameGraph.svg file, you will get different color codes for different type of frames like Green is Java, yellow is C++, orange is kernel, and red is the remainder (native user-level, or kernel modules).
source : Brenden Gregg’s Flame Graph page
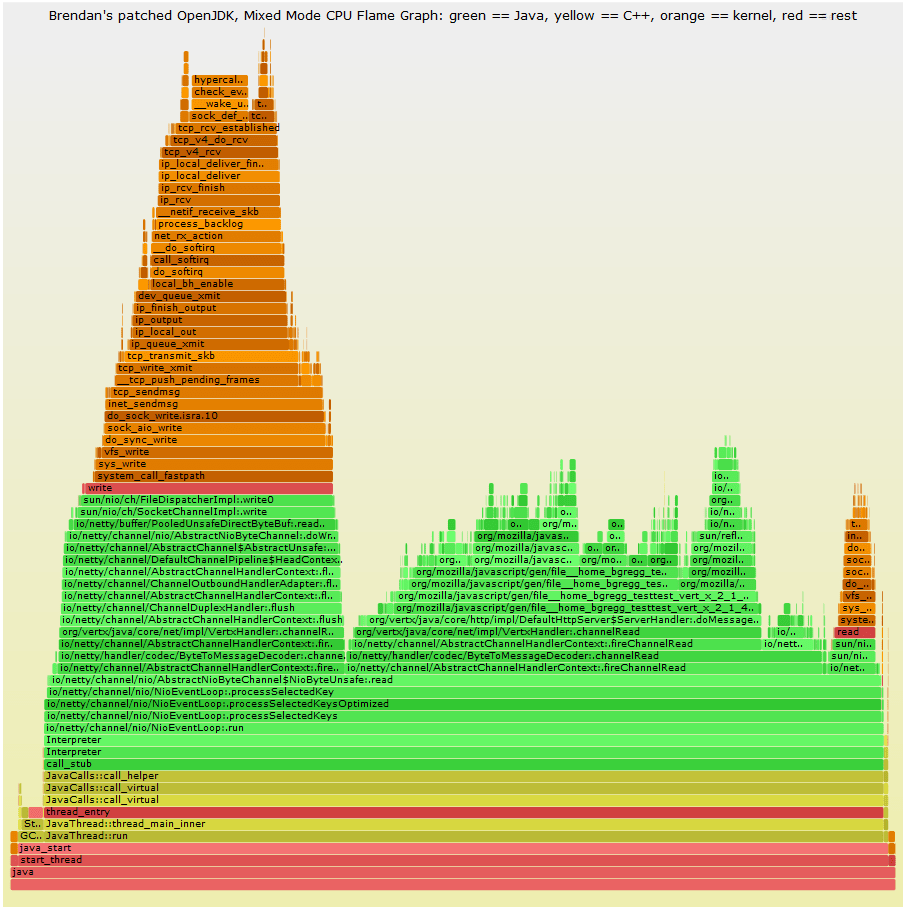
  • In the flame graph, the length of each tile (frame) represents the time it took on cpu. That means, larger the length of a tile, larger was its CPU time. So while debugging an issue, you can pick a larger tile and use it as a starting point for debugging.
  • The stack of functions on the base tile represent the child calls from within the base function. Using this we can see if any non-required / repetitive calls are made to any functions.
  • Also, all flame graphs are interactive. You can click on any function tile and see what % of time was spent on it, number of samples collected and what are the child calls with in.
  • On a whole, Flame Graphs are a great tool to generate interactive profiles to see where most of the CPU time is spent in the code.
  • Although setting up prerequisite & generating FlameGraphs has a steep learning curve, I would say it is a great tool to have in a Performance Engineer’s arsenal.
  • It pays off when you want to look at all the system level (low-level kernel, io etc) and application level (through all stacks) cpu calls in a single place. Most of the other profilers fall short at this.

How it helped me solve a Performance Issue ?

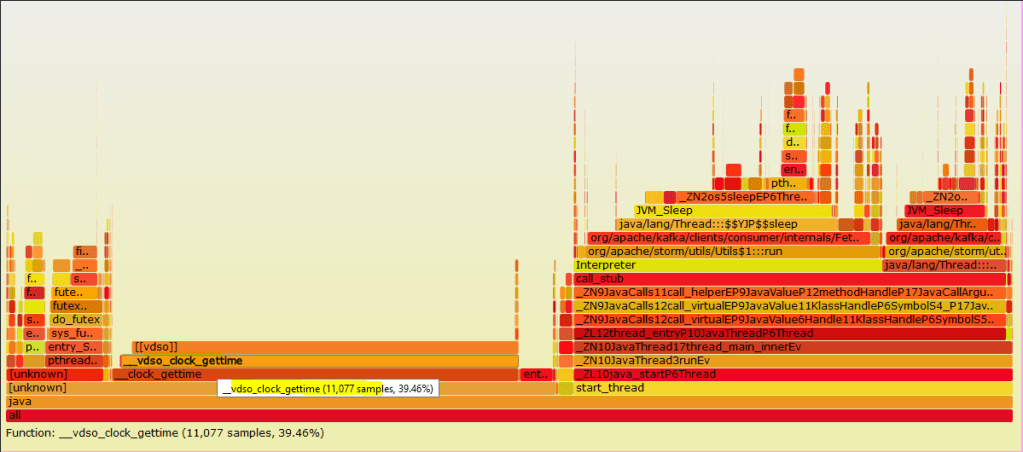
  • I had an issue at hand where the system under test (storm) had high cpu usage even when there was no load.
  • On using Yourkit, I did not get anything in the HotSpot other than some threads which were getting on CPU and then going back to sleep state.
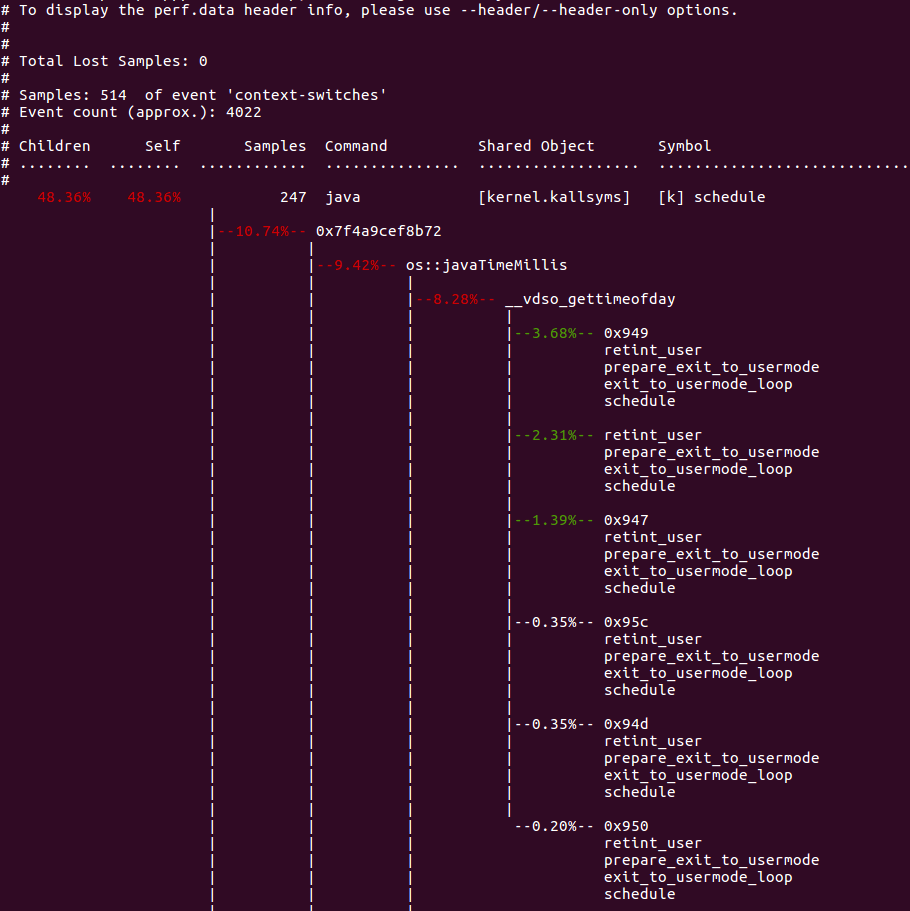
  • On looking at FlameGraph however, I could see that these threads which are periodically waking up are Storm Spouts, that are making a lot of system calls via vDSO(virtual dynamic shared object) to get the clocktime of the system.
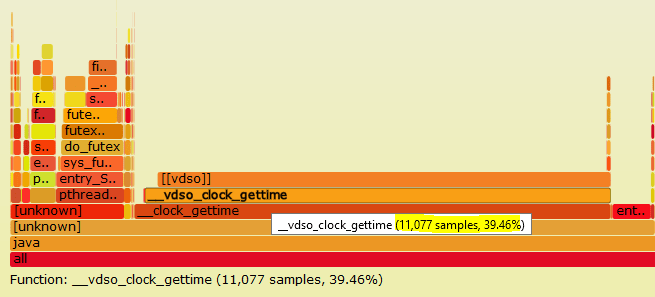
  • This guided me to check the clocksource set on the system, which was xen and then change it to more optimum tsc.
  • Overall helping us save over 30% of CPU time.

Further reading :

Happy tuning.

[Performance] : Profiling with linux Perf command-line tool

Most of the Performance Engineers use some sort of profiling tools like Yourkit, Jprofiler or some APM tools like Newrelic, Datadog, Appdynmics etc. Although these tools are easy to use out of the box and help with Observability, they don’t give a complete picture of a Performance problem at occasions.
This is where perf Linux profiler comes in handy.

This write up is an attempt to explain :
– What is perf Linux profiler ?
– How to set it up ?
– What are its capabilities ?

So, What is perf linux profiler ?

  • perf Linux profiler also known as “Performance Counter for Linux” (PCL), “Linux Perf Events” (LPE) or “perf_events”, is an incredibly powerful tool for Linux Performance investigations. In this article we will refer to it as just “perf tool“.
  • perf tool is a multi-tool which is capable of both Sampling and Tracing. But unlike the traditional profiling tools, perf tool will trace the system calls as well and not just the application calls. This is greatly helpful in debug is system level issues.
  • Using perf tool we can instrument CPU performance counters, tracepoints and do dynamic tracing.
  • From the profile data generated from perf tool, we can create Flame Graphs, which give an amazing insights in to CPU time and call stacks. A detailed article on Flame Graphs is coming in the following weeks.
sample flame graph

How to set up perf ?

  • perf tool is built in to linux kernel tree.
  • However, if you don’t find it in your linux distribution, you can install it like below on Ubuntu machine :
    sudo apt-get install linux-tools-common
  • perf tool is dependent on the kernel version on your system. So if you get any errors, first check the version of you kernel and then install the relevant linux-tools-common version.
    sudo apt-get install linux-tools-common-$(uname -r)
  • Based on the missing dependencies, after above command, it might ask you install a specific version of linux-cloud-tools, do the same.
  • To check if perf tools is installed successfully, just run the command perf. If it returns the output, you are all set !

What are the capabilities of perf linux profiler ?

Things you can do with perf tool

perf tool has way more capabilities than any of the traditional profiling tools. There is too much of information that we can extract out of a system using perf tool, but it is useful only if we know what to make out of it. Using perf tool we can do things like : profile a PID, get the counter stats on a system, get details on reason for context switches & page faults on a system, collect traces for a pid, do dynamic tracing and much more. Let us look a few of them below.

perf stat :

perf stat is used for obtaining performance counter statistics. This can be used for keeping a running count of an execution, which is aggregated in the end and is presented in a output.
* perf stat --help : To get all the options that can be used with stat
* perf stat -d command : To get CPU counter statistics for any command. “-d” gives detailed results.
* perf stat -p PID sleep 10 : To get stats for a particular PID, for 10secs.
* perf stat -e ext4:ext4_request_inode -a sleep 10 : To check the no. of requests for inodes.ext4 file system provides around one hundred tracepoints for visibility into its requests and internals.
* perf stat -e context-switches -a sleep 5 : To get total number of context switches across all CPUs( “-a”). Also, “-e” option is for event selector. use ‘perf list‘ to list available events.
* Using pref stat you can get a lot more information on cpu cache hits / misses, stalled cycles, cpu-migrations etc.

output of perf stat command

perf top :

perf top is a system profiling utility. This command generates and displays a performance counter profile in real time.
* perf top -F 49 : To sample CPUs at 49 Hertz, and show top addresses and symbols, live. “-F” signifies the frequency for profiling.
* Just like the options mentioned in perf stat above, we can use options for getting results for a particular command, for a PID or for a particular event type.

samples collected with perf top

perf record :

perf record is used to collect the system wide statistics. It is basically static tracing, which can be used on a command, pid or particular event type to get the detailed static trace of the same. This is more like what you see on collecting a trace in Yourkit, but along with all the detailed kernel calls. Also, unlike Yourkit where you can collect only CPU traces, using perf record you can collect traces for all system events like context switches, disk IO, inbound/outbound calls etc.
perf record generates a perf.data file, which is consumed by perf reports commands for showing out the details.
* perf record -e sched:sched_process_exec -a sleep 20 : To trace all the new processes for the next 20secs.
* perf record -e context-switches -ag -- sleep 10 : To sample context switching for 10 seconds. “-a” means on all CPUs. “-g” means enabling call graph recording, which will generate detailed stacks in report.
* perf record -F 99 -p PID sleep 10 : To record all the instructions that go on CPU at the frequency of 99Hertz for a specific PID for 10secs.

All the above recordings will generate a perf.data file which is used as input for perf report command for analyzing the recorded samples.

output after running a perf record command

perf report :

The profile data collected by perf record command are saved in perf.data binary file as seen above. perf report reads this binary file and create a report out of it.
* perf report -n : To show the profile data, “-n” shows the details of number of samples collected for each function.

perf report -n

* perf report -n --stdio : To generate the report with stdio interface.

perf report -n –stdio

Side note : Make sure to “overuse” the manual pages in perf tool. It is super helpful in listing all the options that you can use with perf commands. Use --help along with any perf command to get the manual page.

Although this write is an attempt to introduce someone to perf linux profiler, it has far too many capabilities than that can be listed in a single write-up. The followup articles will attempt to get deeper in to perf tool features & generation of Flame Graphs out of perf reports.

Happy tuning!

Important links :

[Performance] : Java’s built in diagnostic tool – Jstat

When it comes to Performance Monitoring and analysis, we tend to think of full fledged license tools like Dynatrace, Newrelic, Appdynamics, Yourkit etc. However, if it is a java application which is under diagnosis, java’s built in tools are a good place to start.

Java comes with a set of built-in diagnostic tools like – Jconsole, jcmd, jstat, jmap, jstack, jvisualvm, jfr and many more. Each of them help in tackling a kind of problem. For the scope of this article, lets look in to how jstat is useful as diagnostic tools.

Jstat :

To know all the capabilities of jstat utility, list the options it has like below.

Gc: Using jstat along with one of its many gc options, one can monitor live gc stats from a java application. Out of all the capabilities of jstat, I like how jstat provides extensive gc stats.

In the below snapshot – “3787” is the pid of the java application and 1000 represents the milli-second interval for every snapshot. Although the number of columns might seem overwhelming in the output below, first 12 columns speak about current capacity and current usage of a space.
First two columns “S0C” and “S1C” talk about “Current survivor space 0 capacity (kB)” and “Current survivor space 1 capacity (kB)”.
S0U” and “S1U” talk about “Survivor space 0 utilization (kB)” and “Survivor space 1 utilization (kB)”
Similarly, the adjacent columns talk about Eden space, Metaspace and Compressed class space.
Below are the other metrics reported :

YGC: Number of young generation garbage collection events.
YGCT: Young generation garbage collection time.
FGC: Number of full GC events.
FGCT: Full garbage collection time.
GCT: Total garbage collection time.

Also, to get the gc stats for individual spaces, you could use other options like -gcmetacapacity, -gcnew, -gcold, -gcoldcapacity etc.

jstat -gc <pid> <time ms>

gccause : This prints the cause for the last GC and current GC.

jstat -gccasuse <pid> <time ms>

gcutil: This is the option I generally use to get the overview of Garbage collection since it gives a concise Summary of garbage collection statistics. Below stats are represented as the percentage utilization of a spaces current capacity (S0, S1, E, O, M, CCS).
YGC represents the number of young gen garbage collections since the start of process and YGCT represents the time spent on it. Similarly FGC and FGCT for Full gen.
GCT represents Total garbage collection time.

jstat -gcutil <pid> <time ms>

Class : This option along with jstat will display statistics about the behavior of the class loader.
As seen below, the outputs lists the number of classes loaded & unloaded, memory impact due to loading and unloading and Time spent performing class loading and unloading.
These metrics are helpful when you want to metrics around number of classes loaded for your application.

jstat -class <pid> <time ms>

Compiler: This prints java’s virtual machine JIT compiler statistics.
As seen in below snapshot, it lists the number of classes compiled, time taken for the same, Failed compilations if any, along with Failed method details.

jstat -compiler <pid> <time ms>

Official documentation link – here

Happy tuning!

[Monitoring] – Paging and Swapping in Memory

As a continuation after understanding Virtual Memory in the previous article, this article tries to explain theways to monitor the same.

Memory can be looked at with two perspectives: Utilization and Saturation.
Utilization tells the memory usage. Checking free/used memory reflects the Utilization.
Saturation tells if the memory is used at its full capacity and how the system is using Virtual memory to deal with memory crunch.
In other words, if demands for memory exceed the amount of main memory, main memory becomes saturated. The operating system may then free memory by employing paging, swapping, and, on Linux, the OOM killer. Any of these activities is an indicator of main memory saturation.
Also, it is important to understand that Paging and Swapping are two different things. More details about the same in the previous article.

Although there are more than one ways of measuring these metrics, lets use sar and vmstat to look in to the same.

Paging:

  • sar is an easy go-to tool for measuring paging metrics. – “sar -B 2” — (-B signifies Paging Statistics).
  • From the below metrics, I would closely look at – majflt/s, pgfree/s, %vmeff.
  • Pgpgin/s & pgpgout/s — This reflects the total kilobytes paged in and out of the disk per second by the system. This is not same as swapping. Paging activity can increase when running a simple program, to get certain part of the code off to the disk or back to the memory.
  • Faults/s — This is the total of minor+major faults that the system had to deal with. This is not a count of only page faults that generated IO’s, since Minor faults are resolved without requiring I/O’s.
  • Majflts/s — This is a key metrics. This measures the disk read activity that were needed  per second, as the memory page was loaded from the disk. A constant high number for major faults indicates that the process is running slow, as it is interrupted too often to read the pages from the disk. This is a good indicator to check if there is a memory crunch. You will see a lot of major faults if the pages loaded in the memory (cache section on running the command “free -m”) previously are thrown out due to shortage of memory and are re-requested again as they are actively worked on.
  • pgfree/s — This accounts for the number of pages placed in the free list by the system. Free list is a list of pages that are unused and are available for immediate allocation, idle memory in other words. So, a large value here mean there were corresponding pageouts.
  • pgscank/s & pgscand/s — These refer to the number of pages scanned by background page-out daemon and also directly.
  • pgsteal/s — These are the number of pages the system has reclaimed from the cache to meet the memory demands.
  • %vmeff — This is an interesting metrics to measure the reclaim efficiency. This is the ratio of Page Steal/Page Scan. Higher value means, most of the pages scanned are stolen back and are freed. If it is 100%, then every page scanned is freed. If it is low (less than 30%), VM is having difficulty freeing the memory. The field would be zero if no pages are getting scanned. So I would be happy to see either zero or 100% here.

Swapping :

  • vmstat is an easy tool to look in to swapping details — “vmstat -S M 2
  • vmstat gives details of memory, cpu, io, run queue length and not just swap details.
  • The swap section here talks about the swapping happening in the system.
  • si / so : These values represent the amount of memory swapped in from the disk and the amount of memory swapped out to the disk. In the above example there is no swap happening at all. These values give a representation of memory saturation of the system.

Although, majority of the focus goes in to Memory Utilization during performance testing, it is important to keep an eye on memory saturation as well. Memory saturation measures the systems capacity to handle the memory crunch if it occurs.

Happy tuning.

[Understanding] : Virtual Memory

As a Performance Engineer you will come across Virtual memory very often specially when monitoring or debugging Memory issues. Virtual memory along with below mentioned terminologies are used very loosely across the industry.
– Page, Page frame, Page fault, Minor/Major fault, Paging, Swapping etc.

This article is an attempt to understand Virtual memory in detail theoretically, in the context of Computer Architecture.

What is virtual memory?

Virtual memory is not the real memory. It is an abstraction layer provided to each process. It is meant to simplify the software development, leaving the physical memory placement to operating system.
To put in very simple terms, the purpose of Virtual memory is to use the hard disk as an extension of RAM, thus increasing the available address space a process can use. Using Virtual memory, system can address more memory than it actually has, and it uses the hard drive to hold the excess. This area on the hard drive is called a page file, because it holds chunks of main memory on the hard drive.

Virtual memory is implemented by using the concept of Paging. So let’s understand paging.

Paging:

  • Paging is a fine grained approach of managing and freeing main memory.
  • The main memory(RAM) and the Virtual memory are divided into fixed-size blocks (which are known as Page frames and Pages respectively) and a process before it gets on to the main memory is also divided in to the same sized blocks. This fixes size is known as Page size which is usually 4 Kbytes.
  • We need not have the whole process (all the pages) in main memory at once for the process to run; virtual memory allows a program to run when only specific pieces are present in memory. The parts not currently being used are stored in the page file on disk.
  • Typically, these fixed sized blocks of the program are off loaded to page file (hard drive) when not needed, which is known as page-out and are brought in to memory when needed, which is known as page-in.
  • The pages can be of two type : Dirty or Clean :
    • Imagine one of the page blocks in the main memory, which the kernel thread writes to page file (hard drive). This page is not instantly freed from the main memory, but is kept around in case something wants to do further IO on it. However, if the memory crunch occurs on main memory, this page will be eligible for clean up since a copy of it is already present in page file.
    • Now, if the page is modified in the main memory, the copy of it in the page file will become outdated. These modified pages in the main memory are marked as Dirty. The page-out will require it to be written to page file and update it.
    • However, if the page in the main memory is not modified after the write to page file, it will be marked as Clean. So, when the main memory crunch occurs, the kernel can just off load them to free the memory without requiring to make any disk write.
    • A kernel thread will wake up periodically and push the cache marked as Dirty to the disk and sync the data, and also mark the cache back as Clean.

Demand Paging :

Most of the operating systems these days support demand paging in which mapping of Virtual memory to Physical memory is done on demand. This reduces the CPU overhead of mapping during the memory allocation until they are really required. In demand paging, when the page is accessed for the first time, there is initially no page mapping a Page fault occurs.
– If the mapping can be satisfied from another page in the memory, it is called Minor fault.
– If the page fault requires hard drive access to get the uncached memory file, it is called Major fault.

Swapping vs Paging :

It is important to note that Swapping and Paging are two different things, although both are used very loosely. Swapping is the movement of entire process between main memory and swap device, where as in Paging parts of not used pages are paged-out. Swapping severely hurts the performance as it involves large number of IO’s to run again. When engineers say that the system is swapping, it is very important to be sure if it is Swapping or Paging.


Conclusion:

  • As a performance engineer, it is important to understand what is virtual memory and how it is used.
  • It is normal for the memory usage to grow as the system boots up and the process starts running as system uses the free memory to cache the file system. In other words, if there is more free memory, the system will keep the pages in main memory (cached) even after page-outs to increase the performance. The bottom line is : If there is free memory, use it for something useful. If the need arises for freeing main memory, the kernel will quickly free the cached and buffer memory for the new needs.
  • So to summarize, when we do “free -m” on a linux machine, there will be a cached section. This holds the page cache data. After page faults, a copy is kept here to make next reads faster. However if memory crunch happens, the kernel can clean out cached/buffers quickly. Thus the memory accounted under “cached” and “buffers” are also as good as free memory.

More on how to monitor Page faults, Page in/outs and what to make out of it in coming articles.

Happy tuning!

[Understanding] : How to read a G1GC log file.

As a Performance Engineer, time and again you will need to look in to GC logs to see how jvm is handling garbage collection.
With G1GC being the default gc for java versions 9 & above, one needs to know what the G1GC log actually reads like.

To get an understanding of G1GC, here is an in-depth material on it from Oracle tutorials. – link

To begin with, there are 50+ jvm parameters for selecting different GC algorithms and customizing them as per requirement.
Below link has cheat sheet for all the jvm parameters that you can select from. – PDF

For a java application, I enabled G1GC along with below jvm parameters to get details gc logs.

-XX:+UseG1GC" -Xloggc:/data1/gc.log -XX:+PrintGCDetails -XX:+PrintGC

A block of the GC log that was generated out of the application was as below :

 2826.897: [GC pause (G1 Evacuation Pause) (young), 0.0035277 secs]  							
   [Parallel Time: 2.1 ms, GC Workers: 8]														
      [GC Worker Start (ms): Min: 2826897.6, Avg: 2826897.7, Max: 2826897.7, Diff: 0.1]			
      [Ext Root Scanning (ms): Min: 1.1, Avg: 1.2, Max: 1.4, Diff: 0.3, Sum: 9.3]				
      [Update RS (ms): Min: 0.4, Avg: 0.5, Max: 0.6, Diff: 0.2, Sum: 4.3]						
         [Processed Buffers: Min: 2, Avg: 30.4, Max: 74, Diff: 72, Sum: 243]					
      [Scan RS (ms): Min: 0.0, Avg: 0.1, Max: 0.1, Diff: 0.0, Sum: 0.4]							
      [Code Root Scanning (ms): Min: 0.0, Avg: 0.0, Max: 0.0, Diff: 0.0, Sum: 0.0]				
      [Object Copy (ms): Min: 0.1, Avg: 0.2, Max: 0.2, Diff: 0.1, Sum: 1.4]						
      [Termination (ms): Min: 0.0, Avg: 0.0, Max: 0.0, Diff: 0.0, Sum: 0.0]						
         [Termination Attempts: Min: 1, Avg: 1.6, Max: 2, Diff: 1, Sum: 13]						
      [GC Worker Other (ms): Min: 0.0, Avg: 0.0, Max: 0.1, Diff: 0.1, Sum: 0.3]					
      [GC Worker Total (ms): Min: 1.9, Avg: 2.0, Max: 2.0, Diff: 0.1, Sum: 15.7]				
      [GC Worker End (ms): Min: 2826899.6, Avg: 2826899.6, Max: 2826899.7, Diff: 0.0]			
   [Code Root Fixup: 0.0 ms]																	
   [Code Root Purge: 0.0 ms]																	
   [Clear CT: 0.2 ms]																			
   [Other: 1.2 ms]
      [Choose CSet: 0.0 ms]
      [Ref Proc: 0.2 ms]
      [Ref Enq: 0.0 ms]
      [Redirty Cards: 0.1 ms]
      [Humongous Register: 0.0 ms]
      [Humongous Reclaim: 0.0 ms]
      [Free CSet: 0.4 ms]
   [Eden: 988.0M(988.0M)->0.0B(988.0M) Survivors: 4096.0K->4096.0K Heap: 1312.2M(1656.0M)->324.2M(1656.0M)]   
 [Times: user=0.01 sys=0.00, real=0.00 secs] 

To know how the garbage collector is performing, it is required to read through the above section and make sense out of it. Lets try to understand what each line means.


2826.897: [GC pause (G1 Evacuation Pause) (young), 0.0035277 secs]

Evacuation started 2826.89 secs form the start of the java process. GC was triggered in Young region(Eden and survivor). It took an overall 3.5ms for completion of the same.

[Parallel Time: 2.1 ms, GC Workers: 8]

There are 8 GC worker threads – defined by –XX:ParallelGCThreads, which took a 2.1ms of Stop The World (STW) time on parallel tasks from Start of collection till the last GC worker ended.
Side Note: Against the common belief, all the minor GC’s do trigger Stop The World pause. Reference link.

[GC Worker Start (ms): Min: 2826897.6, Avg: 2826897.7, Max: 2826897.7, Diff: 0.1]

The start time of worker threads, in avg, min and max form the start of process.

[Ext Root Scanning (ms): Min: 1.1, Avg: 1.2, Max: 1.4, Diff: 0.3, Sum: 9.3]

The time taken by worker threads scanning the external root(JNI, global, thread stack roots, register) to find the reaches of objects in the collection set.

[Update RS (ms): Min: 0.4, Avg: 0.5, Max: 0.6, Diff: 0.2, Sum: 4.3]

Time taken by worker threads for updating Remember sets.
Remember set(RS) : If a garbage collector does not collect the entire heap (an incremental collection), the garbage collector needs to know where there are pointers from the uncollected part of the heap into the part of the heap that is being collected. This is typically for a generational garbage collector in which the uncollected part of the heap is usually the old generation, and the collected part of the heap is the young generation. The data structure for keeping this information (old generation pointers to young generation objects), is a Remembered set.

[Processed Buffers: Min: 2, Avg: 30.4, Max: 74, Diff: 72, Sum: 243]

This shows how many Update Buffers were processed during Update RS

[Scan RS (ms): Min: 0.0, Avg: 0.1, Max: 0.1, Diff: 0.0, Sum: 0.4]

Time spent for scanning the Remembered set to look for references that point to the regions in the Collection Set.

[Code Root Scanning (ms): Min: 0.0, Avg: 0.0, Max: 0.0, Diff: 0.0, Sum: 0.0]

Time spent in scanning the roots of compiled source code

[Object Copy (ms): Min: 0.1, Avg: 0.2, Max: 0.2, Diff: 0.1, Sum: 1.4]

Time spent by worker threads to copy live objects from regions in collection set to new region before the evacuation pause.

[Termination (ms): Min: 0.0, Avg: 0.0, Max: 0.0, Diff: 0.0, Sum: 0.0]

After a gc worker completes its work, it enters terminations routine where it syncs with other workers and tries to steal the outstanding worker. This time represents when a worker first tried to terminate and when it actually terminated.

[Termination Attempts: Min: 1, Avg: 1.6, Max: 2, Diff: 1, Sum: 13]

This counts every-time gc worker thread stole the work and re-entered termination state.

[GC Worker Other (ms): Min: 0.0, Avg: 0.0, Max: 0.1, Diff: 0.1, Sum: 0.3]		
[GC Worker Total (ms): Min: 1.9, Avg: 2.0, Max: 2.0, Diff: 0.1, Sum: 15.7]	
[GC Worker End (ms): Min: 2826899.6, Avg: 2826899.6, Max: 2826899.7, Diff: 0.0]

GC Worker Other : Time spent performing tasks not accounted in above GC steps.
GC Worker Total : Sum of the time spent by each worker thread on GC.
GC Worker End : The timestamp since the start of JVM when the GC work ended.

[Code Root Fixup: 0.0 ms]
[Clear CT: 0.2 ms]	

Code Root Fixup : Time spent in fixing the roots for objects in collection set with new pointers that may have moved during the GC.
Clear CT : After the garbage collection, purge the entries from code root table.

[Eden: 988.0M(988.0M)->0.0B(988.0M) Survivors: 4096.0K->4096.0K Heap: 1312.2M(1656.0M)->324.2M(1656.0M)]

Reflects how the heap has changed after GC. The young collection was triggered because Eden space was full at 988Mb. After the collection usage on Eden space was reduced to zero bytes. Survivor space was not collected in this cycle. Heap usage overall was reduced from 1312Mb to 324Mb after the GC.


Please share your thoughts in the comments section.
Happy tuning!

[Performance Debugging] : Root causing “Too many open files” issue

Operating system : Linux

This is a very straight forward write-up on how to root cause “Too many open files” error seen during high load Performance Testing.

This article talks about:

  • The ulimit parameter “open files”,
  • Soft and Hard ulimits
  • What happens when the process overflows the upper limit
  • How to root cause the source of file reference leak.

Scenario :

During a load test, as the load increased, I was seeing failures in transaction with error “Too many open files”.


Thought Process / background:

As most of us already know, we see “Too many open files” error when the total number of open file descriptors crosses the max value set.

There are couple of important things to note here :

  • Ulimit means – User limit for the use of system wide resources. Ulimit provided control over the resources available to the shell and the process started by it.
    • Check the user limit values using the command – ulimit -a
  • These limits can be set to different values to different users. This is to let larger set of system resources to be allocated to a user who owns most of the process.
    • Command to check ulimit values for different user —  sudo – <username> -c “ulimit -a”
  • Ulimit in itself is of two kinds. Soft limit and Hard limit.
    • A hard limit is the maximum allowed values to a user, set by the superuser/root. This value is set in the file /etc/security/limits.conf. Think of it as an upper bound or ceiling or roof.
      • To check hard limits – ulimit -H -a
  • A soft limit is the effective value right now for that user. The user can increase the soft limit on their own in times of needing more resources, but cannot set the soft limit higher than the hard limit.
    • To check soft limits – ulimit -S -a

Now that we know to a fair extent about ulimit, let’s see how we can root cause the reason for “Too many open files” error and not just increase the max limits for the parameter.


Debugging:

  • I was running a load test(that deals with a lot of files) and after a certain load limit, the test started to fail.
  • Logs showed exceptions with stacks leading to “Too many open files” error.
  • First instinct – Check the values set for open file descriptor.
    • Command –  ulimit -a
    • Note: it is important to check the limits for the same user who owns the process.
  • The value was set to a very low limit of 1024. I increased it to a larger value of 50,000, and quickly reran the test. (link on how to make the change mentioned in above section)
  • Test started failing even after increasing the open file descriptor values.
  • I wanted to see what where these file references which were being held on to. So I took a dump of open file references, and wrote to a file.
    •  lsof > /tmp/openfileReferences.txt

  • Above commands dumps the files referenced all the users. Grep out the output only for the user that you are interested in .
    •  lsof | grep -i “apcuser” > /tmp/openfileReferences.txt
  • Now if you look in to the lsof dump, you will see the second column being the ProcessID which is holding on to the file references.
  • You can run the below awk command which sums up the list of open files per process, sorts it based on the process holding max number of files and lists the top 20.
    • cat openfile.txt | awk ‘{print $2 ” ” $1; }’ | sort -rn | uniq -c | sort -rn | head -20
  • That’s it ! Now open the dump files and look at the files held in reference (last column from lsof dump.). It will give the file which is held in reference.
  • In my case, it was a huge list of temp files which were created during the process, but the stream was not closed, leading to file reference leaks.

Happy tuning!