
This writeup is more of a demo to showcase the power of “proc” (process information pseudo-filesystem) interface in linux to get the memory details of process, and also a quick brief on the power of “proc interface”.
In the current trend of building abstraction over abstractions in software/tooling, very few tend to care about the source of truth of a metrics. There are various APM / Monitoring tools to get the memory details of a process for a linux system, but when the need arises, I believe, one must know the ways of going closer to the source of truth on a linux system and verify things.
So, What is proc ?
proc stands for “process information pseudo-filesystem.”
proc is a pseudo-filesystem that provides an interface to the Linux kernel. It is generally mounted at /proc and is mounted automatically by the system.
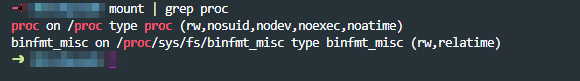
As seen above, on listing the mounts, you can see the device proc, which is not really a device, but is just the listed as word proc meaning that it’s a kernel interface.
In proc, you can see three different categories of information mainly.
- sys directory – has details for files, kernel, networking, virtual memory etc of the system.
- pid directories – which contains details of what a process is doing at process level.
- status files like – cpuinfo, meminfo etc of the system.
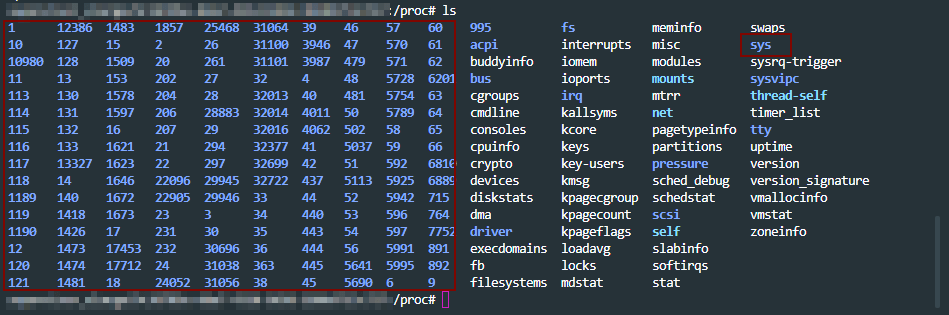
A lot of the linux toolings like ps get the process level information from /proc path. An overview of proc at the man page – here
With that general overview of proc interface, let move to getting memory information for a process in detail for our use case.
Scenario: A java process is crash periodically and consistently. How to get the memory details for the pid using /proc interface ?
To begin with, there are more than one ways of doing this analysis. For example: set up auto dump generators on heap(JVM params) and set up the core dump generation on ulimit. Get the dumps on crash and work backwards by analyzing them.
Since the intention here is to discover the capabilities of /prod/pid/* tooling, we will try and collect metrics from these toolings for our analysis.
First, lets collect the metrics for the java process running on the system from the /proc directory as the java process is running, so that we can analyze it. A tiny shell script for that below.
ps = "java";
seconds = "60";
dir = "memstats";
while sleep
  $seconds;
do
  ts = "$(date +'%F-%T' | tr : -)";
echo "Collecting memory statistics for process(es) '$ps' at timestamp '$ts'";
for pid
  in $ (pidof $ps);
do
  echo "- Process ID: $pid";
pdir = "$dir/$ps/$ts/$pid";
mkdir - p $pdir;
cp / proc / $pid /
{
maps, numa_maps, smaps, smaps_rollup, status}
$pdir /;
done;
done
The above script:
– creates the directory structure
– monitors the running java processes every 60secs
– copies the /proc/$pid metrics dump to the above directory structure
Let the above script run and collect the metrics, as the java process we are monitoring is getting to crash. Once we have the metrics collected, lets look in to the memory details of the pid crashing.

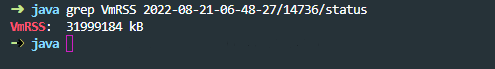
- The system under test had 32 GB memory in my case.
- If we look at the vmRSS memory for the process dump, we see that java process is consuming all 32GB of the memory. Notice that
statusfile is looked in to from/proc/pidwhich has the memory usage details for the process.
- This is reflected closely by the sum of Rss values of each VM area/section collected in above dump. Note that we are digging in to
smapsfrom/proc/pidto get these details on each VM section here for cross validation.

- One observations on object sizes is, the VMAs with RSS on 10 MB or more (5 or more digits for kB field) are 429, which we get by looking in to
smapsfor the pid.

- Before the next observation, look at one of the entires of an object in
smapsfile.

smapsfile for the pid in/prochas a lot of details about the residing objects which are consuming the memory. Going back to the objects of size more than 10MB, all 429 objects don’t have any file reference which were holding the memory in my case, and the allocation wasAnonymous.(refer to Anonymous row in the above image)

- “Anonymous” shows the amount of memory that does not belong to any file. More details on Anonymous reference on the kernel documentation here
- In short, what the above data points infer is, for the java process which is crashing, all the size does not come from jvm heap but comes from non-java / C-style allocation. Most probably the crash is happening JNI layer.
- In such cases, you will not even see any heap dump getting generated. However, core dumps will be generated as diagnostic dumps for analysis if the “
core file size” is set to unlimited in “ulimit“. More details on how to get core dumps here . - With the above details, this might be due an internal library which is used in the application which is non-java and is causing the crash.
- From here you can look at “
maps” file under “/proc/$pid/” to look at all the non".jar” files to look at the non-java references and analyze it further.

- In my case, it was a bunch of non-standard libraries which were packaged, that was causing the crash in JNI layer. Updating which solved the issue.
Conclusion:
- There are always more than one ways of solving the problem.
- The purpose of this write up again, was to show the power of understanding linux process diagnostics that come with built in with
"/proc” interface. - Building abstractions and not letting ssh access to vms (which is the current industry trend) is great, but going closer to the source of truth can help solve problem sometimes when you know what you are looking for.
Until next time, happy tuning!