“A professional is someone who may not have all the answers, but thoroughly studies their craft and seeks to hone their skills. A professional will freely admit when they don’t know the answer, but you can count on a professional to find it.”
Here are a bunch of Technical / Non-Technical topics that I came across recently and found them very resourceful.
Technical :
Amazon S3 on it’s 15th Birthday — It is Still Day 1 after 5,475 Days & 100 Trillion Objects. An article here.
A detailed Performance comparison of different programming languages / command-lines. Link here. (If you can’t read full article, go through the conclusion for insight)
The Amazon VP & CTO, Werner Vogels sits with Tom Killalea to discuss designing for evolution at scale. Article here.
ShortcutFoo is a site for spaced repetition of helpful shortcuts across tech stacks. Check it here.
Non-Technical :
Flamshot, an amazing multi-functional screenshot capturing tool. Check it here . Download link.
(Highly Recommended) : The context of “Why’s!” by Richard Feynman. Youtube link [Length – 7min]
Tim Ferriss podcast with Jordan Peterson(Canadian professor of psychology) as a guest. You can definitely learn new things here – link. [Youtube. Length – 1hr 20mins]
Extract from a book:
“One lesson I’ve learned is that if the job I do were easy, I wouldn’t derive so much satisfaction from it. The thrill of winning is in direct proportion to the effort I put in before. I also know, from long experience, that if you make an effort in training when you don’t especially feel like making it, the payoff is that you will win games when you are not feeling your best. That is how you win championships, that is what separates the great player from the merely good player. The difference lies in how well you’ve prepared.”
I am sure most of you follow HackerNews. Here is a great tool built using FlameGraphs to navigate through big threads on HN. – Link1 , Link2
Non-Technical :
A cool site where you can select the part of the body and find the relevant stretches and exercises here
An extract from something I am reading:
“Almost universally, the kind of performance we give on social media is positive. It’s more “Let me tell you how well things are going. Look how great I am.” It’s rarely the truth: “I’m scared. I’m struggling. I don’t know.”
In this world of Microservices and the distributed systems, a single request (generally) hops through multiple servers before being served. More often than not, these hops are also across the Network cards making the Network Performance the source of slowness in the application. These parameters makes the need to measure Network performance between servers/systems more critical for benchmarking or debugging.
Iperf3 is one of the open source tools which can be used for network throughput measurement. Below are some of its features.
Iperf3 can be used for testing maximum TCP and UDP throughput between two servers.
Iperf3 tests can also be run in a controlled to way to not test the maximum limits but ingest and constant lower network traffic for testing.
Iperf3 has options for parallel mode(-P) where multiple clients can be used, setting CPU affinity(-A), pausing certain intervals between two requests(-i), setting the length of buffer to read or write(-l), setting target bandwidth (-b) etc.
More important than anything is the fact that iperf3 runs as an independent tool outside your application code. The results from this tool removes any ambiguities/doubts on the application code which might be causing the network problems.
Installation of iperf3 tool:
sudo apt-get install iperf3
iperf3 tool has be installed on both servers between which you want to measure the network performance. One of the machines is treated as client and other as server.
Command to run on the server:
Below command when run on one of the two servers under test, signifies that the machine is acting as a server for the iperf test.
iperf3 -s -f K
-s — runs in server mode
-f K — signifies the format as KBytes. Note : If you do not want to use the default port (which is 5201) for the test, then specify the port with the option -p in the above command and use the same on client as well.
Command to run on the client:
Below command when run on the other server under test, pushes network bandwidth to server and reports the network capacity based on options used.
From the output (last two lines), it can be seen that the total bandwidth available between the two servers is 708MBytes/sec.
There are also various other options available for iperf3 tool. Like the below command specifies the test to be run for 60secs, which is by default 10secs (-t 60), specifies a target bandwidth of 10MB (-b 10M), number of parallel client streams set to 10 (-P 10).
Below are some of the cases where I have used iperf3 for debugging purpose:
Throughput of the application doesn’t scale but there is no obvious resource contention in cpu, memory or disk. On running “sar -n DEV 2 20” I could see network usage doesn’t peak above 30MB/sec. On using Iperf3 for benchmarking we could see 30Mb/sec was the max network capacity between the servers.
When we wanted to find the impact of vpn on the network throughput we used iperf tool for comparative analysis.
Hope this gave you a sneak peak into iperf3 tool’s capability and usages. Happy tuning!
In the previous article about Java Thread Dumps (link here) we looked in to a few basics on Thread dumps(When to take?, How to take?, Sneak peaks? etc.)
In this write up, I wanted to mention a few tools which can ease the process of collecting and analyzing thread dumps.
Collecting multiple thread dumps:
I prefer command-line over any APM tools for taking thread dumps. The best way for analyzing threads is to collect a few thread dumps (5 to 10) and look through the transition in the state of threads.
As mentioned in the previous article(link), one of the ways is using jstack, which is built in to jdk. Below command will collect 10 thread dumps with a time interval of 10sec between each. All dumps are written to a single file ThreadDump.jstack.
You can further split the 10 thread dumps to individual files using the csplit command. The below command basically looks for the line “Full thread dump OpenJDK” which is printed at the started of each thread dump and splits the dump in to individual ones.
To start with, there are many tools like VisualVM, Jprofiler, Yourkit and many more online aggregators for visualizing and analyzing ThreadDumps. Each one have their own pros & cons. Here is a small list of available tools – link
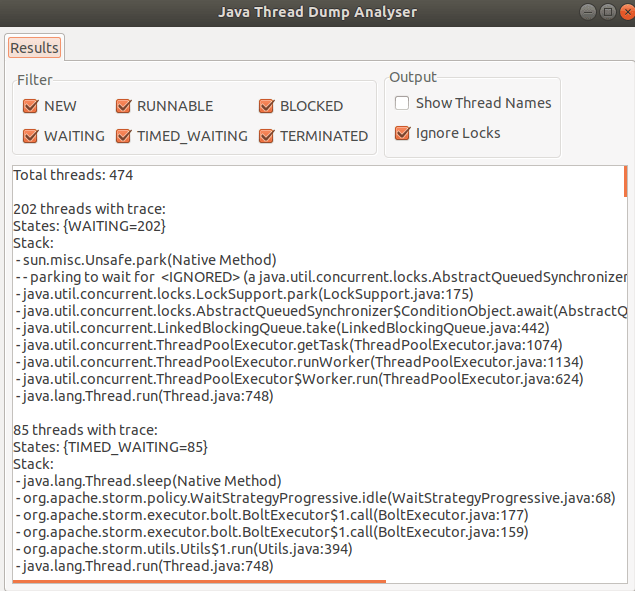
I generally use the “Java Thread Dump Analyser” (JTDA) tool from here.
This tool is available as a jar, to which you can feed the Thread dump file via command line and visualize Threads grouped in there States. You would appreciate this grouping if you have analyzed Thread Dumps in vim which had 100’s and 100’s of lines.
java -jar jtda.jar <ThreadDumpFilePath>
Here are some of the features which I like about JTDA tool:
light weight and doesn’t need any configuration.
you can upfront get the count of threads in all states
you can only look in to threads that are in a certain state (Runnable / Waiting / Blocked etc)
threads with same stack are grouped together for ease of reading
“show thread name” if checked, give the name of thread pool for better context.
On the foot note, when looking in to thread dumps, it is very important to know the code paths and the request flows. This helps in root causing the issue and better reading / understanding of thread dumps.
Here are a bunch of Technical / Non-Technical topics that I came across recently and found them very resourceful.
Technical :
BPF(Berkeley Packet Filter) has come a long way from just being a packet capture tool to advance Performance analysis tool (EBPF – Extended Berkeley Packet Filter). Here (link) is an introduction to EBPF. Also here (link) is a talk on how BPF is used at Netflix.
“Minimal safe Bash script template” – link . Because there is no such thing as “knowing enough of bash!”
Kelsey Hightower is an inspiration. A writeup on how he made it from McDonald’s to Google (link). [HIGHLY RECOMMENDED] –> : A talk he gave about his journey a few years back here (link)
[That time of the year!] : “Best talks of 2020” — link
[Late news!] If you didn’t hear it already, Github has Dark mode now. – link
Non-Technical :
[Another one] “Ask HN: What book changed your life in 2020?” – some great recommendations here – link . Personally for me, “Sapiens” widened my horizon about evolution of Human Beings.
“100 Tips for better life.” – link – I don’t agree with all of them, but most of these are thought provoking.
An extract from the book that I am reading.
At the core of all anger is a need that is not being fulfilled.
The second edition of “System Performance: Enterprise and Cloud” – by Brendan Gregg releasing on 2nd December. – link . This is “the best” reference guide for Performance Engineering.
Non-Technical :
“Library of Scroll” – Here is a site with one great article every Monday. Since it is just one, generally I find them very good. – link
Great site with short explanations of over 24 cognitive biases. Co-authored by Gabriel Weinberg who is the CEO of DuckDuckGo. – link
Not sure why I liked this, but this “57 Years Apart – A Boy And a Man Talk About Life” short video was quite gripping. – link
Soft skills for Software Engineers. Short thread. – link
Hand picked remote jobs from “Hacker News Who is hiring” November – link
Extract from a book:
“Respect an old tradition path as it is well tested, but also be open to the new modern way of things as they open up your mind.”
A few short thoughts / ideas wrt of Performance centric product.
In this world of infinite scaling of computes, pay close attention to common choke points. Like DB, storage(s) etc, which are shared by all the computes.
Majority of the reads and writes have to happen in Bulk operations and NOT as single read/writes. Specially when there are 100’s-1000’s of reads/writes/deletes on storage(s).
Threads. Pay close attention to which part of the entire flow is multi-threaded. Sometimes, only a small part of the flow is multi-threaded, but entire application is called multi-threaded, which is wrong.
Don’t just look at throughput for certifying if an application is performing good / bad. Scenario 1: Throughput:100docs/sec, Object size:100Kb Scenario 2: Throughput:50docs/sec, Object size:200Kb In both the cases about the amount of data transferred on network is 10,000Kb/sec (9.7Mb/sec). So pay attention to network stats and size of objects as well.
Databases. Make sure important collections have indexes. (There is so much more to DB tuning. This could be starting point)
Introduce local cache on computes wherever possible to avoid network calls to DB’s. Be 100% sure on your logic on when to invalidate the cache. If we don’t invalidate the cache and use the stale cached data, that could lead to incorrect transactions.
Failures are important. Pay close attention to reducing the failures. If something has to fail, then fail early on its compute cycle, so that CPU cycles are not wasted on failures.
When you do retries due to failures in your system, make sure to have logarithmic back offs. Meaning, if a message failed, 1st retry after 1min, 2nd retry after 2mins, 3rd after 4mins etc. This give system time to recover. Also retry only for finite number of times.
Pay very close attention on logic for when to mark a failure as Temporary vs Permanent. If a failure which should be permanent is wrongly marked as temporary, then the request keeps coming back to the compute via retries and wastes the CPU cycles.
Timeouts and Max connection pool sizes! Make a note of all the timeout that are set across talks between different fabrics / api calls in your application. Also, see the configuration for connections pools used in the application. Both might result in spike of failures if crossed.
[Update:]
Redundancy, Isolation and Localization are the core of any reliable system. Redundancy in the service to handle any failures. Isolation to break transactions in to independent smaller services. Localization so that you have all the required compute and data locally in the service with minimum/none external dependency.
Here are a bunch of Technical / Non-Technical topics that I came across recently and found them very resourceful.
Technical :
How to become a consultant ? Some good references and advices here. – link
Ever wondered How the prices vary on Amazon? Here is a classic example of algorithmically priced products on Amazon – link
If you are using O’Reilly (which I believe is the best technical content platform), you should check out O’Reilly Answers. For all your queries, O’Reilly looks through heap of books, video and conferences and gives you answers. – link (Note: You will need subscription)
In Firefox version 81, an experimental event delay tracker has been added. Details in the “Performance Tools” section of below article (old article dated August 31st). – link . Also example profile – link
This is first of a two parts article which talks about:
What are thread dumps?
When to take thread dumps ?
How to take thread dumps ?
What is inside a thread dumps ?
What to look for in a thread dump?
Majority of the systems today are mutlicore and hyper-threaded. Threading at the software level allows us to take advantage of a system’s mutlicores to achieve the desired pace and efficiency of the application operations. Along with pace and efficiency, multi-threading brings its own set of problems w.r.t thread contentions, thread racing, high CPU usage etc. In this write up we will see how to debug these problems by taking thread dumps on java applications.
What are thread dumps ?
A thread dump is a runtime state of a program at a particular point in time. It can also be looked at as a snapshot of all the threads that are alive on the JVM. In a mutli-threaded java application there can be 100’s of threads. Although mutli-threading improves the efficiency of an application, it makes it complex to know what is happening at a given point in the application. This is where thread dumps come in handy, which gives us a textual representation of all the thread stacks of all the threads in the application.
When to take thread dumps ?
Thread dumps can be helpful in the scenarios like: – you want to know the state of application. – you want to know if all the threads from the assigned thread pool are used and are doing work. – when you are seeing high CPU and want to see which current running threads are causing high cpu. – when you are seeing unusual slowness in the application. – with certain jvm parameters, jvm takes auto thread dumps if jvm crashes to help debugging the crash.
How to take thread dumps ?
Two easy ways of taking thread dumps are using jstack or with kill -3 command.
It is best to take a bunch of thread dumps with a slight time gap to better analyse the application. If you use jstack, you could take 10thread dumps with 10seconds sleep time between each, using below shell command. Note: replace <pid> with your process id in below command.
There is enough content available online on these. So I will link them below. – Oracle documentation on jstack link – Redhat knowledge base link – Tutorial point link – Multiple other ways link – If you are using kill -3, note that thread dumps will go to system out of JVM – link
What is inside a thread dump ?
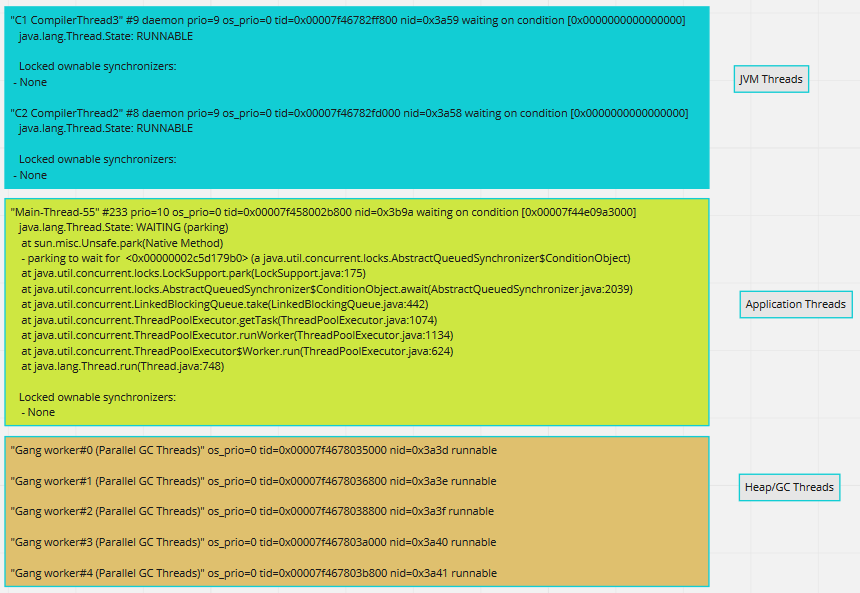
Now that we are done with boilerplate sections, lets see the main part. When you open a thread dump, you generally see three kinds of threads. JVM threads(some), Application threads(many) and Heap/GC threads(few). Snippets of these threads are shown below.
Three kinds of threads in ThreadDumps
Elements in a single thread stack:
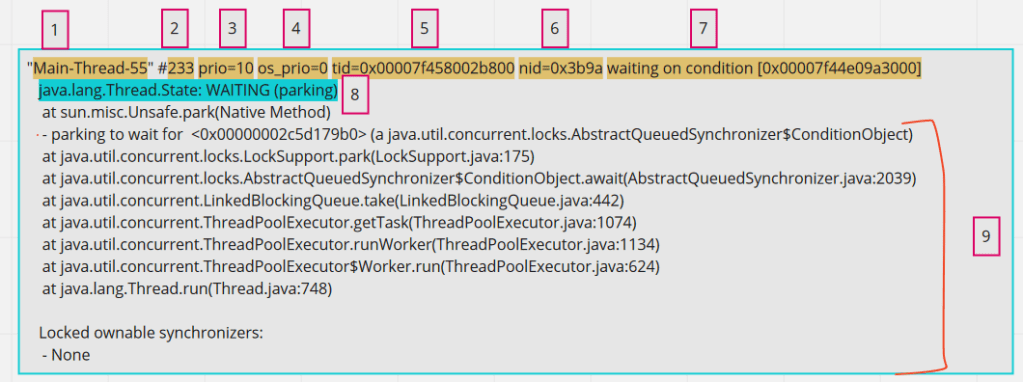
For debugging an application, Application threads are our area of interest. When inspecting a single Application thread, it has below parts in it.
components of a single application thread
1 – Thread name, obvious and straight forward . 2 – Number id of thread. This will get incremented everytime there is a new thread created for that thread pool. 3 – JVM priority. This number signifies the priority of the thread in JVM. Java exposes api for setting thread priority. 4 – Priority of a thread on the operating system. 5 – Thread id for the thread in the memory 6 – Native thread id assigned to JVM by OS. This is important of correlating JVM threads with OS threads. 7 – This is optional seen only when the thread is waiting on some condition. May not be always. 8 – Thread state. In my opinion, this is overrated and generally over-analyzed. Reflect the current state of the thread. 9 – Thread call stack. Reads bottom-up. Gives the stack of thread.
States of a thread:
This is element [8] in the above highlighted breakdown. Below are the different states that a thread might be in.
RUNNABLE – This is the thread which is running on CPU and actively executing code.
WAITING – A threads in this state will wait indefinitely unless some other thread wakes it up. Some examples are threads which are waiting on IO or threads waiting for data to be returned from DB.
TIMED_WAITING – Similar to waiting but the thread will wake up after a specific period of time. Storm Spout threads which wake up every few seconds are a good example.
BLOCKED – Threads waiting to acquire a monitor lock. In Java, blocks of code can be marked as “synchronized”, so when a thread acquires a monitor lock, other threads will wait in this state, until the monitor is available.
NEW & TERMINATED – these states are rarely seen and are of least interest.
What to look for in a thread dump?
Now that we know most part of what can be found in a thread dump, lets see what we should be looking at for analysis.
The first important thing is to look at your application threads related info to begin with. For this, pay attention to thread name ( Element [1] in above breakdown). Obviously one would know the thread pools created by the application, and you need to look at the threads whose name belong to this Thread pool names.
Look out for the threads in RUNNABLE state amongst the above selected application threads. These are the threads which are actually doing the work and running on the cpu. Example: If a thread pool of 200 is set and if only 10 of those threads are in RUNNABLE state, then you might want to look at what rest of the 190 threads are doing.
Even in the RUNNABLE threads, it is important to see if the thread is busy executing any NATIVE methods. When you see the calls being made to Native methods in the thread dump, that means the thread is not executing Application code at that point, but is executing JNI (java native interface) code. Native methods are pre-compiled piece of codes from JVM which might be serving small specific purposes like reading from socket connections (like in below example), making file system calls etc. If you see a lot of threads in RUNNABLE state, but are busy executing Native methods, then it might not be application code issue but environment issue in itself. More often, some other tools like sTrace are coupled with Thread dumps to root cause these issues, which we shall discuss in next article.
An application thread in Runnable state executing Native method
As mentioned in the section, How to take thread dumps, generally it is good to take a few thread dumps (like 10) to understand the state of threads better. These are particularly helpful in looking at code stagnation. Since thread dumps are snap shots of current state of thread, you might want to see if a particular thread that you are interested in (if in Waiting state), is in the same state across all the dumps collected.
See if any threads are in BLOCKED state. From the stack trace of the thread, look for the part which says – “waiting to lock <_id here>“. On searching the entire ThreadDump with the same thread_id, you see get to know the thread which is holding the lock and also the problematic object, which in below example is threadstates.Foo.
Example code from the internet
The stack trace of threads are important as they help you correlate the problem to the code sections from your application. So it is important to pay close attention to the stack of a thread.
In the next part we will see some practical cases of using Thread dump for analysis, Tools that can be used for analyzing thread dumps.