a lovely side project from Mouse Reeve on building Maps – Youtube link
Applying new hardware advancements and benchmarking variants of old databases — link here
Cost per Gigabyte on RAM is much lower now than it used to be decade ago.
Alternative approaches considered:log-less databases, single-threaded databases, and transaction-less databases, for certain use cases.
I have been re-reading the very famous book “Designing Data-Intensive Applications” by Martin Kleppmann. I am publishing my notes and extracts from the book — link here
Non-Technical :
Speed matters: Why working quickly is more important than it seems — link here
With “Openhimer” being released past week, did you notice a common theme across Nolan’s movies? — Tweet here
This is “The Best” longform article that I have read in years. Below are a few extracts from the same:
“The way to figure out what to work on is by working. If you’re not sure what to work on, guess. But pick something and get going.“ “Develop a habit of working on your own projects. Don’t let “work” mean something other people tell you to do.” “When in doubt, optimize for interestingness. But a field should become increasingly interesting as you learn more about it.” “People who do great work are not necessarily happier than everyone else, but they’re happier than they’d be if they didn’t.”
This is a new series of publications where I am publishing my self notes/extracts from reading the very famous book – DDIA (Designing Data-Intensive Applications) by Martin Kleppmann.
This particular article is from the first chapter of the book. Again, these are just my self notes/extracts and treat this more like an overview/summary. Best way is to read the book in itself.
Side note: I am a terribly slow and repetitive reader. The update between chapters might take weeks.
Reliable, Scalable and Maintainable Applications
CPU not a constrain any more in computing. CPUs these days are inexpensive and more powerful.
General problems these days are complexity of data, amount of data and rate at which the data changes.
Below are the common functionalities of a data intensive application
Store data so that they, or another application, can find it again later (databases)
Remember the result of an expensive operation, to speed up reads (caches)
Allow users to search data by keyword or filter it in various ways (search indexes)
Send a message to another process, to be handled asynchronously (stream processing)
Periodically crunch a large amount of accumulated data (batch processing)
[not imp but note]: “Although a database and a message queue have some superficial similarity—both store data for some time—they have very different access patterns, which means different performance characteristics, and thus very different implementations.”
“there are datastores that are also used as message queues (Redis), and there are message queues with database-like durability guarantees (Apache Kafka). The boundaries between the categories are becoming blurred.”
Reliability
“The system should continue to work correctly (performing the correct function at the desired level of performance) even in the face of adversity (hardware or software faults, and even human error).”
“The things that can go wrong are called faults, and systems that anticipate faults and can cope with them are called fault-tolerant or resilient.”
“Note that a fault is not the same as a failure [2]. A fault is usually defined as one component of the system deviating from its spec, whereas a failure is when the system as a whole stops providing the required service to the user”
Every software system must be designed to tolerate some kind of failures rather than preventing every – but some kind of failures are better prevented – Example: Security related failures.
Hardware Faults
hard disk crash, RAM fautly, power grid failure, someone unplugging wrong network cable
“Hard disks are reported as having a mean time to failure (MTTF) of about 10 to 50 years [5, 6] Thus, on a storage cluster with 10,000 disks, we should expect on average one disk to die per day.”
for hardware failure the first solution is build redundency in the software to handle the failure of one hardware component. Having replicas. Also, Being software tolerant for hardware failures, Example: make the system read only when more than 2/3 nodes are down.
“On AWS it is fairly common for virtual machine instances to become unavailable without warning [7], as the platforms are designed to prioritize flexibility and elasticity over single-machine reliability.”
Software Faults
There can be systemic errors in the system that can cause all the nodes of a cluster to go down as a repel effect. Example: 1 nodes on DB cluster – and all the heavy queries that killed the node1 are now shifted node2. The cluster now has one less node but has to deal with all the load – leading to failure of other nodes.
“The bugs that cause these kinds of software faults often lie dormant for a long time until they are triggered by an unusual set of circumstances.”
“There is no quick solution to the problem of systematic faults in software. Lots of small things can help: carefully thinking about assumptions and interactions in the system; thorough testing; process isolation; allowing processes to crash and restart; measuring, monitoring, and analyzing system behavior in production.”
Human Errors
“Even when they have the best intentions, humans are known to be unreliable”
10-25% of internet outages are due to wrong configuration by humans.
Some ways to consider in design
“Design systems in a way that minimizes opportunities for error. For example, well-designed abstractions, APIs, and admin interfaces make it easy to do “the right thing” and discourage “the wrong thing.” However, if the interfaces are too restrictive people will work around them, negating their benefit, so this is a tricky balance to get right.”
A staging env for people to try , explore and fail
Testing deeply
Make the recovery easy – roll back should be always faster
“Set up detailed and clear monitoring, such as performance metrics and error rates. In other engineering disciplines this is referred to as telemetry.”
Scalability
“As the system grows (in data volume, traffic volume, or complexity), there should be reasonable ways of dealing with that growth.”
one common reason for degraded performance of an application is – higher load/users that the system is designed for. Applications handling more data than it did before.
Questions to consider during the design of a scalable application: “If the system grows in a particular way, what are our options for coping with the growth?” and “How can we add computing resources to handle the additional load?”
Consider Twitter system design solution for scalability
Twitter has two main operations –
(1) Post a Tweet – (4.6k requests/sec on average, over 12k requests/sec at peak)
(2) Pull the timeline – (300k requests/sec).
So, most of the operations are around pull timeline – i.e, reading the tweets. Twitter’s challenge is not around handling the number of people who tweet, but around number of people who read and pull those tweets on their timelines.
There are two ways to implement the solution.
everytime someone tweets, write it to a DB. When the follower pull their timeline, pull that tweet from the DB
every time someone tweets, deliver it to all their followers more like a mail – keep it some each user cache. So when the followers pull the timelines, the tweets come from their cache instantly.
Option 2 is more effective because – the number of people who are tweeting are less, but the number of people who are pulling the timeline are more. But this means there will be more work now when tweeting, second order effect.
lets say, I have 10million followers. So when I tweeet, I have to update the cache of 10million followers, so that when they pull their timeline, the tweets are ready.
to avoid that – a hybrid model can be followed. If the user has more than, lets say, 5million followers – update their tweets to a common cache. So when the user pull the timeline – use both option 1 and 2 and merge them based on the people they are following.
Average response times – and why you should avoid “average” in general.
Avrg are the worst. They take in to account all the outliers and screw up the avrg number reported. Avrg doesn’t tell you how many users actually experienced the delay.
Average is nothing but the arithmetic mean. (given n values, add up all the values, and divide by n.)
“Usually it is better to use percentiles. If you take your list of response times and sort it from fastest to slowest, then the median is the halfway point: for example, if your median response time is 200 ms, that means half your requests return in less than 200 ms, and half your requests take longer than that”
note : Median is same as P50 – 50th percentile
“if the 95th percentile response time is 1.5 seconds, that means 95 out of 100 requests take less than 1.5 seconds, and 5 out of 100 requests take 1.5 seconds or more”
also, Latency and Response time are not the same. Response time is what the client sees(processing time+network time+client render time). Latency is however the time spent by the request waiting to be served. Latent – awaiting service.
Two imp questions to answer during performance testing
If I increase the load without increasing the system resources, how is the performance of the system affected? Is it usable at all?
How much of the resources and what all services have to be scaled when the load increases, so that the performance of the application is not degraded?
“a system that is designed to handle 100,000 requests per second, each 1 kB in size, looks very different from a system that is designed for 3 requests per minute, each 2 GB in size—even though the two systems have the same data throughput”
Maintainability
I thought this section made a lot of obvious commentary. Skimmed and skipped most.
“Over time, many different people will work on the system and they should be able to work on it productively”
Has three parts to it. Operability, Simplicity, Evolvability
Operability
Monitoring, Tracking, Keeping software uptodate, SOPs, Security updates, Following best practices, Documentation
Simplicity
reduce accidental complexity by introducing good abstraction.
Evolvability
services should be created independent
follow microservice and 12 Factor app rules to keep them truly independent
If you have used any of the monitoring or APM tools, you would have come across Histogram form of metric being emitter. This writeup give a brief on why Histogram.
Book recommendation – Being Geek by Michael Lopp. I have been geeking out on Michael quite a bit these days and he has solid books and advices across the internet.
Non-Technical :
“A Checklist For First-Time Engineering Managers” – link here
Any lofi lovers here? Best lofi with air traffic control radio mix. My new WFH companion for background audio — link here
This is such a pleasant read on WFH day and the pace of it on a rand community channel, almost therapeutic – link here
An extract from the book:
And like it or not, your boss is judging you by these three criteria:
COMMITMENT ATTENTION TO DETAIL IMMEDIATE FOLLOW UP
Here are a bunch of Technical / Non-Technical topics that I came across recently and found them very resourceful.
Technical :
A new book released on the hot eBPF – “Learning eBPF” by Liz Rice. This a summary form and a quick introduction to eBPF capabilities when compared to “BPF Performance tools” by Brendan Gregg.
To understand latency in detail – “Everything You Know About Latency Is Wrong” – link here
Why Percentiles Don’t Work the Way You Think ? Reason to stop using Average value of metrics and how percentiles work. Link here
Here is a detailed and practical resource on System Design in Software Engineering – link here
“Effective and Efficient Observability with OpenTelemetry” – opentelemetry is the way to go when it comes to traces/metrics observability in your code base. – link here
This is a lovely visualization – “Visualizing Lucene’s segment merges” – link here
50 Ideas that changed my life – David Perell. Link here . My fav one from the 50 is:
“By reading this, you are choosing not to read something else. Everything we do is like this. Doing one thing requires giving up another. Whenever you explicitly choose to do one thing, you implicitly choose not to do another thing.“
Mental Liquidity – ability to quickly abandon previous beliefs when the world changes or when you come across new information. link here
“Two types of Software Engineers” – One assumes it’s easy because it’s a non-technical problem, the other assumes that’s why it’s hard – link here
[Recommended] – “What you give up when moving into engineering management” – Link here
Quote from a book:
I write everything down, and since I put my notes where they will pop up again in the right place at the right time, once I have written something down I forget about it. The end result is that when I break from work, I break from work-related stress as well.
What They Don’t Teach You at Harvard Business School
When setting expectations, no matter what has been said or written, if substandard performance is accepted and no one is held accountable—if there are no consequences—that poor performance becomes the new standard. Therefore, leaders must enforce standards.
Here are a bunch of Technical / Non-Technical topics that I came across recently and found them very resourceful.
Technical :
It is December and Advent of code is here. What is Advent of code ? – link here. An old podcast on Spotify’s Engineering team geeking out every December on AOC – link here
[A talk – 31mins ] – Concurrency is not Parallelism – “Concurrency is about dealing with lots of things at once. Parallelism is about doing lots of things at once.” – YouTube
Observability is all about Metrics, Events, Logs and Traces [MELT]. The four core metrics types explained in detail here
From P99 Performance conference for 2022 – the power of eBPF for performance insights — link here
[Book]: Opentelemetry is the second most active CNCF project, next to K8. Opentelemetry is the next standard for implementing vendor agnostic observability into any application. Below is a great report on the same.
Non-Technical :
The perks of High Documentation, Low Meetings work culture – link here
Richard Feynman’s way of taking pressure off yourself and doing something for the fun of it. – link here
[Documentary – 40mins] – The speed cubers on netflix – link here
Which books have made you a better thinker and problem solver? – some great recommendations here
An extract from a book:
How we tend to view the worst events in History? We tend to assume that the worst that has happened is the worst that can happen, and then prepare for that. We forget that “the worst” smashed a previous understanding of what was the worst. Therefore, we need to prepare more for the extremes allowable by physics rather that what has happened until now.
This writeup is more of a demo to showcase the power of “proc” (process information pseudo-filesystem) interface in linux to get the memory details of process, and also a quick brief on the power of “proc interface”.
In the current trend of building abstraction over abstractions in software/tooling, very few tend to care about the source of truth of a metrics. There are various APM / Monitoring tools to get the memory details of a process for a linux system, but when the need arises, I believe, one must know the ways of going closer to the source of truth on a linux system and verify things.
So, What is proc ?
proc stands for “process information pseudo-filesystem.” proc is a pseudo-filesystem that provides an interface to the Linux kernel. It is generally mounted at /proc and is mounted automatically by the system.
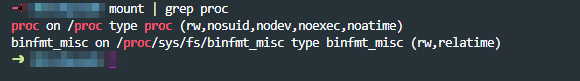
listing mounts
As seen above, on listing the mounts, you can see the device proc, which is not really a device, but is just the listed as word proc meaning that it’s a kernel interface.
In proc, you can see three different categories of information mainly.
sys directory – has details for files, kernel, networking, virtual memory etc of the system.
pid directories – which contains details of what a process is doing at process level.
status files like – cpuinfo, meminfo etc of the system.
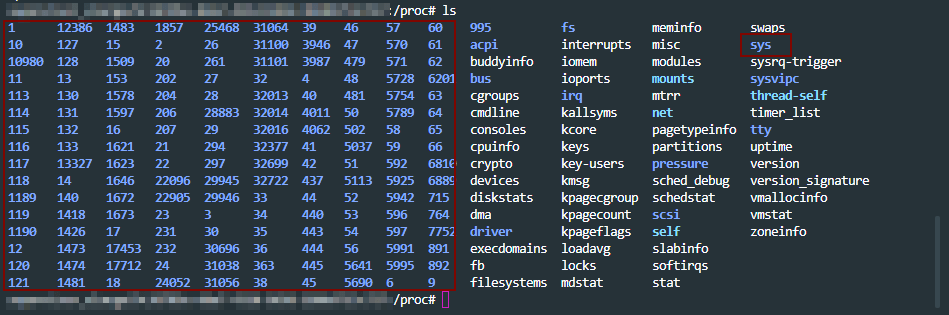
a look into /proc path. pids, sys highlighted. Rest are status files.
A lot of the linux toolings like ps get the process level information from /proc path. An overview of proc at the man page – here
With that general overview of proc interface, let move to getting memory information for a process in detail for our use case.
Scenario: A java process is crash periodically and consistently. How to get the memory details for the pid using /proc interface ?
To begin with, there are more than one ways of doing this analysis. For example: set up auto dump generators on heap(JVM params) and set up the core dump generation on ulimit. Get the dumps on crash and work backwards by analyzing them.
Since the intention here is to discover the capabilities of /prod/pid/* tooling, we will try and collect metrics from these toolings for our analysis.
First, lets collect the metrics for the java process running on the system from the /proc directory as the java process is running, so that we can analyze it. A tiny shell script for that below.
ps = "java";
seconds = "60";
dir = "memstats";
while sleep
  $seconds;
do
  ts = "$(date +'%F-%T' | tr : -)";
echo "Collecting memory statistics for process(es) '$ps' at timestamp '$ts'";
for pid
  in $ (pidof $ps);
do
  echo "- Process ID: $pid";
pdir = "$dir/$ps/$ts/$pid";
mkdir - p $pdir;
cp / proc / $pid /
{
maps, numa_maps, smaps, smaps_rollup, status}
$pdir /;
done;
done
The above script: – creates the directory structure – monitors the running java processes every 60secs – copies the /proc/$pid metrics dump to the above directory structure
Let the above script run and collect the metrics, as the java process we are monitoring is getting to crash. Once we have the metrics collected, lets look in to the memory details of the pid crashing.
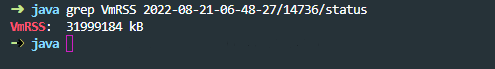
metrics collected before the process crashed from above script
The system under test had 32 GB memory in my case.
If we look at the vmRSS memory for the process dump, we see that java process is consuming all 32GB of the memory. Notice that status file is looked in to from /proc/pid which has the memory usage details for the process.
This is reflected closely by the sum of Rss values of each VM area/section collected in above dump. Note that we are digging in to smaps from /proc/pid to get these details on each VM section here for cross validation.
One observations on object sizes is, the VMAs with RSS on 10 MB or more (5 or more digits for kB field) are 429, which we get by looking in to smaps for the pid.
Before the next observation, look at one of the entires of an object in smaps file.
details of one of the objects in smaps file. Similar details for each object will be present in the smaps file.
smaps file for the pid in /proc has a lot of details about the residing objects which are consuming the memory. Going back to the objects of size more than 10MB, all 429 objects don’t have any file reference which were holding the memory in my case, and the allocation was Anonymous. (refer to Anonymous row in the above image)
we are trying to get all the objects which are over 10MB, and have a file reference to them. We get zero such files.
“Anonymous” shows the amount of memory that does not belong to any file. More details on Anonymous reference on the kernel documentation here
In short, what the above data points infer is, for the java process which is crashing, all the size does not come from jvm heap but comes from non-java / C-style allocation. Most probably the crash is happening JNI layer.
In such cases, you will not even see any heap dump getting generated. However, core dumps will be generated as diagnostic dumps for analysis if the “core file size” is set to unlimited in “ulimit“. More details on how to get core dumps here .
With the above details, this might be due an internal library which is used in the application which is non-java and is causing the crash.
From here you can look at “maps” file under “/proc/$pid/” to look at all the non ".jar” files to look at the non-java references and analyze it further.
In my case, it was a bunch of non-standard libraries which were packaged, that was causing the crash in JNI layer. Updating which solved the issue.
Conclusion:
There are always more than one ways of solving the problem.
The purpose of this write up again, was to show the power of understanding linux process diagnostics that come with built in with "/proc” interface.
Building abstractions and not letting ssh access to vms (which is the current industry trend) is great, but going closer to the source of truth can help solve problem sometimes when you know what you are looking for.
This writeup is a dump of my study notes on most frequently used docker commands for reference. This is just a self reference page and will get updated on the go
To run a container from an image
docker run <image name>
To run a docker image with a specific tag. Example below of pulling redis image with tag4.0. You will get these tag details on the dockerhub page for the image
docker run redis:4.0
To run a docker image in detached mode
docker run -d <image_name>
To run a docker image and login to the container directly
docker run -it <image_name>
To list all the docker images
docker images
To pull a docker image from dockerhub but not run it.
docker pull <image_name>
To list all the docker containers
docker ps -a
To stop a docker container
docker stop <container_name>
To remove a docker container form the disk. Note: This will remove the container permanently. It will not list anymore in docker ps -a. However, the image still exists. The exited/stopped containers do not consume any CPU or memory, but they still use the machine’s disk space.
docker rm <container_name>
To remove a docker image
docker rmi image
To execute a command in a running docker container
Here are a bunch of Technical / Non-Technical topics that I came across recently and found them very resourceful.
Technical :
A few interesting and hidden features of Python – link
Below are the BCP tools that can be used for digging in to Performance analysis of memory parameters on a Linux machine. More in BPF Performance Tools book by Brendan Gregg.
At around 8-10years of experience, career branches in to either Engineering management or Technical Staff Engineer. Here are a few stories of Staff Engineers and their journey.
[Self-endorsement]: A tiny 50lines of code tool for getting my highlighted quotes from my Fav books – here
Non-Technical :
[Highly recommended]: First-principles thinking is a competitive advantage because almost no one does it. More here
The importance of annual health checkup – Seema’s True story of battling cancer – here
I always thought about a social platform but based on Books. Booqsi is trying to do the exact same. It is still in early beta though. More details here
A website that removes things from images in seconds- Magic Eraser
What Got You Here Won’t Get You There: Book Summary – here
Podcast : Hugh Jackman – on Daily routine, intuition, meditation, decision making and more. link
A quote that the struck right chords:
“If you are not willing to take responsibility for your situation, you cannot use your situation as an excuse either.”