In the previous article about Java Thread Dumps (link here) we looked in to a few basics on Thread dumps(When to take?, How to take?, Sneak peaks? etc.)
In this write up, I wanted to mention a few tools which can ease the process of collecting and analyzing thread dumps.
Collecting multiple thread dumps:
I prefer command-line over any APM tools for taking thread dumps. The best way for analyzing threads is to collect a few thread dumps (5 to 10) and look through the transition in the state of threads.
As mentioned in the previous article(link), one of the ways is using jstack, which is built in to jdk. Below command will collect 10 thread dumps with a time interval of 10sec between each. All dumps are written to a single file ThreadDump.jstack.
a=1; while [ $a -le 10 ]; do jstack -l <pid> >> ThreadDump.jstack && sleep 10; a=`expr $a + 1`; doneYou can further split the 10 thread dumps to individual files using the csplit command. The below command basically looks for the line “Full thread dump OpenJDK” which is printed at the started of each thread dump and splits the dump in to individual ones.
csplit -z ThreadDump.jstack /Full\ thread\ dump\ OpenJDK\ 64-Bit\ Server/ '{*}' 
Tools for visualizing and analyzing ThreadDumps:
To start with, there are many tools like VisualVM, Jprofiler, Yourkit and many more online aggregators for visualizing and analyzing ThreadDumps. Each one have their own pros & cons.
Here is a small list of available tools – link
I generally use the “Java Thread Dump Analyser” (JTDA) tool from here.
This tool is available as a jar, to which you can feed the Thread dump file via command line and visualize Threads grouped in there States. You would appreciate this grouping if you have analyzed Thread Dumps in vim which had 100’s and 100’s of lines.
java -jar jtda.jar <ThreadDumpFilePath>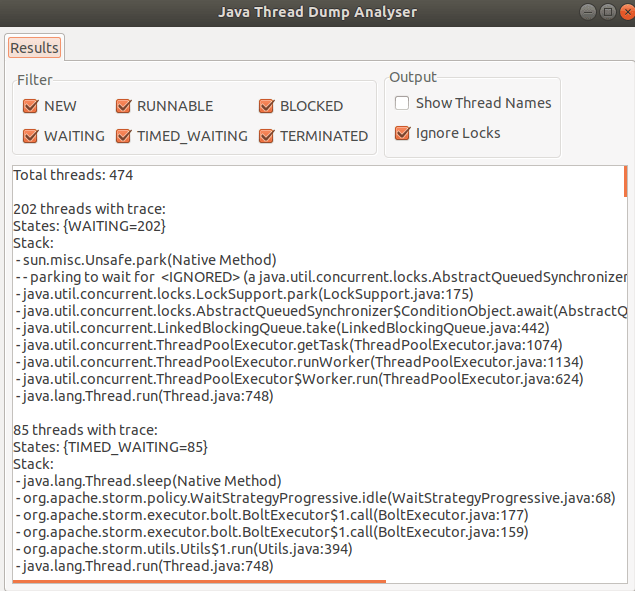
Here are some of the features which I like about JTDA tool:
- light weight and doesn’t need any configuration.
- you can upfront get the count of threads in all states
- you can only look in to threads that are in a certain state (Runnable / Waiting / Blocked etc)
- threads with same stack are grouped together for ease of reading
- “show thread name” if checked, give the name of thread pool for better context.
On the foot note, when looking in to thread dumps, it is very important to know the code paths and the request flows. This helps in root causing the issue and better reading / understanding of thread dumps.
Happy tuning.

One thought on “[Performance] : Java Thread Dumps – Part2”