This is first of a two parts article which talks about:
- What are thread dumps?
- When to take thread dumps ?
- How to take thread dumps ?
- What is inside a thread dumps ?
- What to look for in a thread dump?
Majority of the systems today are mutlicore and hyper-threaded. Threading at the software level allows us to take advantage of a system’s mutlicores to achieve the desired pace and efficiency of the application operations. Along with pace and efficiency, multi-threading brings its own set of problems w.r.t thread contentions, thread racing, high CPU usage etc. In this write up we will see how to debug these problems by taking thread dumps on java applications.
What are thread dumps ?
A thread dump is a runtime state of a program at a particular point in time. It can also be looked at as a snapshot of all the threads that are alive on the JVM. In a mutli-threaded java application there can be 100’s of threads. Although mutli-threading improves the efficiency of an application, it makes it complex to know what is happening at a given point in the application.
This is where thread dumps come in handy, which gives us a textual representation of all the thread stacks of all the threads in the application.
When to take thread dumps ?
Thread dumps can be helpful in the scenarios like:
– you want to know the state of application.
– you want to know if all the threads from the assigned thread pool are used and are doing work.
– when you are seeing high CPU and want to see which current running threads are causing high cpu.
– when you are seeing unusual slowness in the application.
– with certain jvm parameters, jvm takes auto thread dumps if jvm crashes to help debugging the crash.
How to take thread dumps ?
Two easy ways of taking thread dumps are using jstack or with kill -3 command.
It is best to take a bunch of thread dumps with a slight time gap to better analyse the application. If you use jstack, you could take 10thread dumps with 10seconds sleep time between each, using below shell command. Note: replace <pid> with your process id in below command.
a=1; while [ $a -le 10 ]; do jstack -l <pid> >> bigdump.jstack && sleep 10; a=`expr $a + 1`; done
There is enough content available online on these. So I will link them below.
– Oracle documentation on jstack link
– Redhat knowledge base link
– Tutorial point link
– Multiple other ways link
– If you are using kill -3, note that thread dumps will go to system out of JVM – link
What is inside a thread dump ?
Now that we are done with boilerplate sections, lets see the main part.
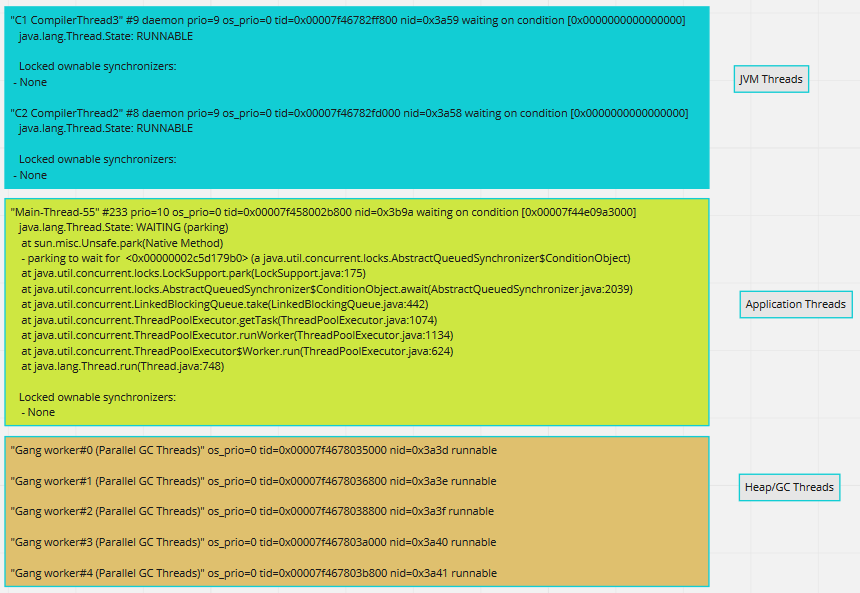
When you open a thread dump, you generally see three kinds of threads.
JVM threads(some), Application threads(many) and Heap/GC threads(few). Snippets of these threads are shown below.
Elements in a single thread stack:
For debugging an application, Application threads are our area of interest. When inspecting a single Application thread, it has below parts in it.
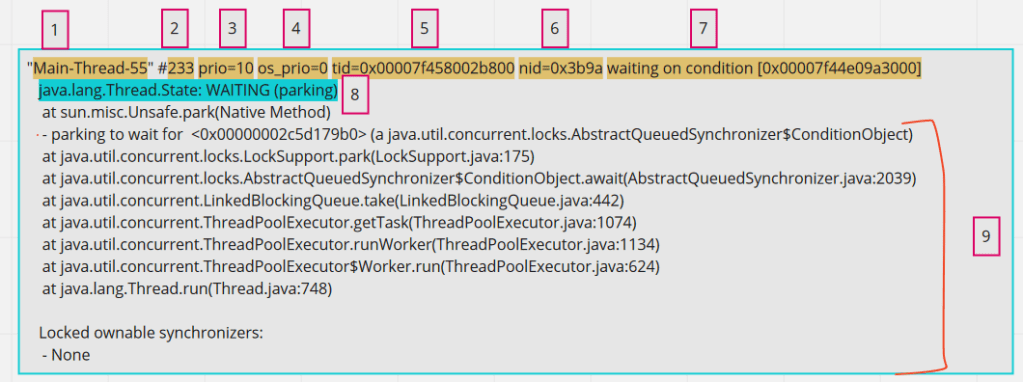
1 – Thread name, obvious and straight forward .
2 – Number id of thread. This will get incremented everytime there is a new thread created for that thread pool.
3 – JVM priority. This number signifies the priority of the thread in JVM. Java exposes api for setting thread priority.
4 – Priority of a thread on the operating system.
5 – Thread id for the thread in the memory
6 – Native thread id assigned to JVM by OS. This is important of correlating JVM threads with OS threads.
7 – This is optional seen only when the thread is waiting on some condition. May not be always.
8 – Thread state. In my opinion, this is overrated and generally over-analyzed. Reflect the current state of the thread.
9 – Thread call stack. Reads bottom-up. Gives the stack of thread.
States of a thread:
This is element [8] in the above highlighted breakdown.
Below are the different states that a thread might be in.
RUNNABLE, WAITING, TIMED_WAITING, BLOCKED, NEW, TERMINATED
- RUNNABLE – This is the thread which is running on CPU and actively executing code.
- WAITING – A threads in this state will wait indefinitely unless some other thread wakes it up. Some examples are threads which are waiting on IO or threads waiting for data to be returned from DB.
- TIMED_WAITING – Similar to waiting but the thread will wake up after a specific period of time. Storm Spout threads which wake up every few seconds are a good example.
- BLOCKED – Threads waiting to acquire a monitor lock. In Java, blocks of code can be marked as “synchronized”, so when a thread acquires a monitor lock, other threads will wait in this state, until the monitor is available.
- NEW & TERMINATED – these states are rarely seen and are of least interest.
What to look for in a thread dump?
Now that we know most part of what can be found in a thread dump, lets see what we should be looking at for analysis.
- The first important thing is to look at your application threads related info to begin with. For this, pay attention to thread name ( Element [1] in above breakdown). Obviously one would know the thread pools created by the application, and you need to look at the threads whose name belong to this Thread pool names.
- Look out for the threads in RUNNABLE state amongst the above selected application threads. These are the threads which are actually doing the work and running on the cpu.
Example: If a thread pool of 200 is set and if only 10 of those threads are in RUNNABLE state, then you might want to look at what rest of the 190 threads are doing. - Even in the RUNNABLE threads, it is important to see if the thread is busy executing any NATIVE methods. When you see the calls being made to Native methods in the thread dump, that means the thread is not executing Application code at that point, but is executing JNI (java native interface) code.
Native methods are pre-compiled piece of codes from JVM which might be serving small specific purposes like reading from socket connections (like in below example), making file system calls etc. If you see a lot of threads in RUNNABLE state, but are busy executing Native methods, then it might not be application code issue but environment issue in itself. More often, some other tools like sTrace are coupled with Thread dumps to root cause these issues, which we shall discuss in next article.

- As mentioned in the section, How to take thread dumps, generally it is good to take a few thread dumps (like 10) to understand the state of threads better. These are particularly helpful in looking at code stagnation. Since thread dumps are snap shots of current state of thread, you might want to see if a particular thread that you are interested in (if in Waiting state), is in the same state across all the dumps collected.
- See if any threads are in BLOCKED state. From the stack trace of the thread, look for the part which says – “waiting to lock <_id here>“. On searching the entire ThreadDump with the same thread_id, you see get to know the thread which is holding the lock and also the problematic object, which in below example is threadstates.Foo.

- The stack trace of threads are important as they help you correlate the problem to the code sections from your application. So it is important to pay close attention to the stack of a thread.
In the next part we will see some practical cases of using Thread dump for analysis, Tools that can be used for analyzing thread dumps.
Happy tuning!
PS: Part 2 of the series is available here

One thought on “[Performance] : Java Thread Dumps – Part1”