Most of the Performance Engineers use some sort of profiling tools like Yourkit, Jprofiler or some APM tools like Newrelic, Datadog, Appdynmics etc. Although these tools are easy to use out of the box and help with Observability, they don’t give a complete picture of a Performance problem at occasions.
This is where perf Linux profiler comes in handy.
This write up is an attempt to explain :
– What is perf Linux profiler ?
– How to set it up ?
– What are its capabilities ?
So, What is perf linux profiler ?
- perf Linux profiler also known as “Performance Counter for Linux” (PCL), “Linux Perf Events” (LPE) or “perf_events”, is an incredibly powerful tool for Linux Performance investigations. In this article we will refer to it as just “perf tool“.
- perf tool is a multi-tool which is capable of both Sampling and Tracing. But unlike the traditional profiling tools, perf tool will trace the system calls as well and not just the application calls. This is greatly helpful in debug is system level issues.
- Using perf tool we can instrument CPU performance counters, tracepoints and do dynamic tracing.
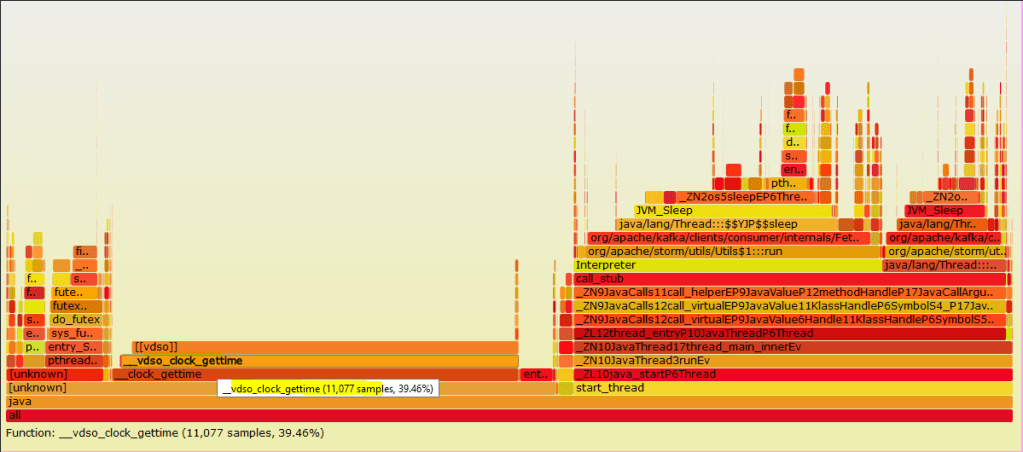
- From the profile data generated from perf tool, we can create Flame Graphs, which give an amazing insights in to CPU time and call stacks. A detailed article on Flame Graphs is coming in the following weeks.
How to set up perf ?
- perf tool is built in to linux kernel tree.
- However, if you don’t find it in your linux distribution, you can install it like below on Ubuntu machine :
sudo apt-get install linux-tools-common - perf tool is dependent on the kernel version on your system. So if you get any errors, first check the version of you kernel and then install the relevant linux-tools-common version.
sudo apt-get install linux-tools-common-$(uname -r) - Based on the missing dependencies, after above command, it might ask you install a specific version of
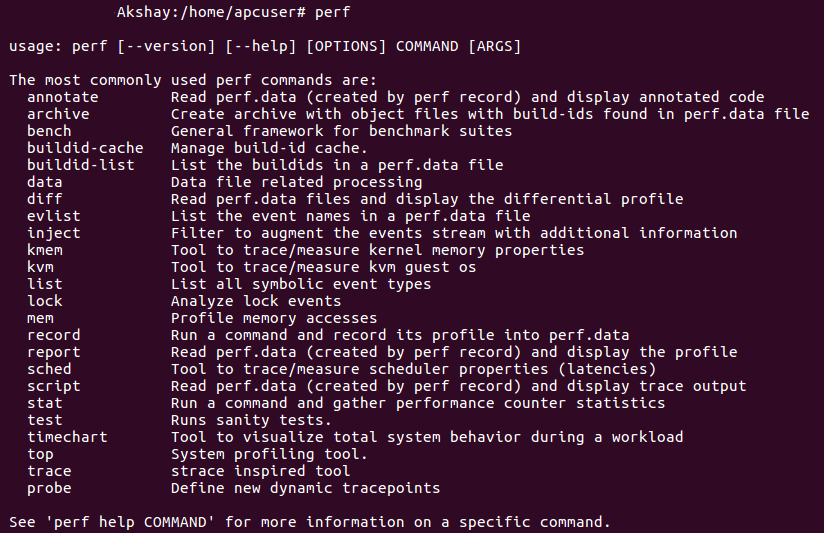
linux-cloud-tools, do the same. - To check if perf tools is installed successfully, just run the command
perf. If it returns the output, you are all set !
What are the capabilities of perf linux profiler ?
perf tool has way more capabilities than any of the traditional profiling tools. There is too much of information that we can extract out of a system using perf tool, but it is useful only if we know what to make out of it. Using perf tool we can do things like : profile a PID, get the counter stats on a system, get details on reason for context switches & page faults on a system, collect traces for a pid, do dynamic tracing and much more. Let us look a few of them below.
perf stat :
perf stat is used for obtaining performance counter statistics. This can be used for keeping a running count of an execution, which is aggregated in the end and is presented in a output.
* perf stat --help : To get all the options that can be used with stat
* perf stat -d command : To get CPU counter statistics for any command. “-d” gives detailed results.
* perf stat -p PID sleep 10 : To get stats for a particular PID, for 10secs.
* perf stat -e ext4:ext4_request_inode -a sleep 10 : To check the no. of requests for inodes.ext4 file system provides around one hundred tracepoints for visibility into its requests and internals.
* perf stat -e context-switches -a sleep 5 : To get total number of context switches across all CPUs( “-a”). Also, “-e” option is for event selector. use ‘perf list‘ to list available events.
* Using pref stat you can get a lot more information on cpu cache hits / misses, stalled cycles, cpu-migrations etc.

perf top :
perf top is a system profiling utility. This command generates and displays a performance counter profile in real time.
* perf top -F 49 : To sample CPUs at 49 Hertz, and show top addresses and symbols, live. “-F” signifies the frequency for profiling.
* Just like the options mentioned in perf stat above, we can use options for getting results for a particular command, for a PID or for a particular event type.

perf record :
perf record is used to collect the system wide statistics. It is basically static tracing, which can be used on a command, pid or particular event type to get the detailed static trace of the same. This is more like what you see on collecting a trace in Yourkit, but along with all the detailed kernel calls. Also, unlike Yourkit where you can collect only CPU traces, using perf record you can collect traces for all system events like context switches, disk IO, inbound/outbound calls etc.
perf record generates a perf.data file, which is consumed by perf reports commands for showing out the details.
* perf record -e sched:sched_process_exec -a sleep 20 : To trace all the new processes for the next 20secs.
* perf record -e context-switches -ag -- sleep 10 : To sample context switching for 10 seconds. “-a” means on all CPUs. “-g” means enabling call graph recording, which will generate detailed stacks in report.
* perf record -F 99 -p PID sleep 10 : To record all the instructions that go on CPU at the frequency of 99Hertz for a specific PID for 10secs.
All the above recordings will generate a perf.data file which is used as input for perf report command for analyzing the recorded samples.

perf report :
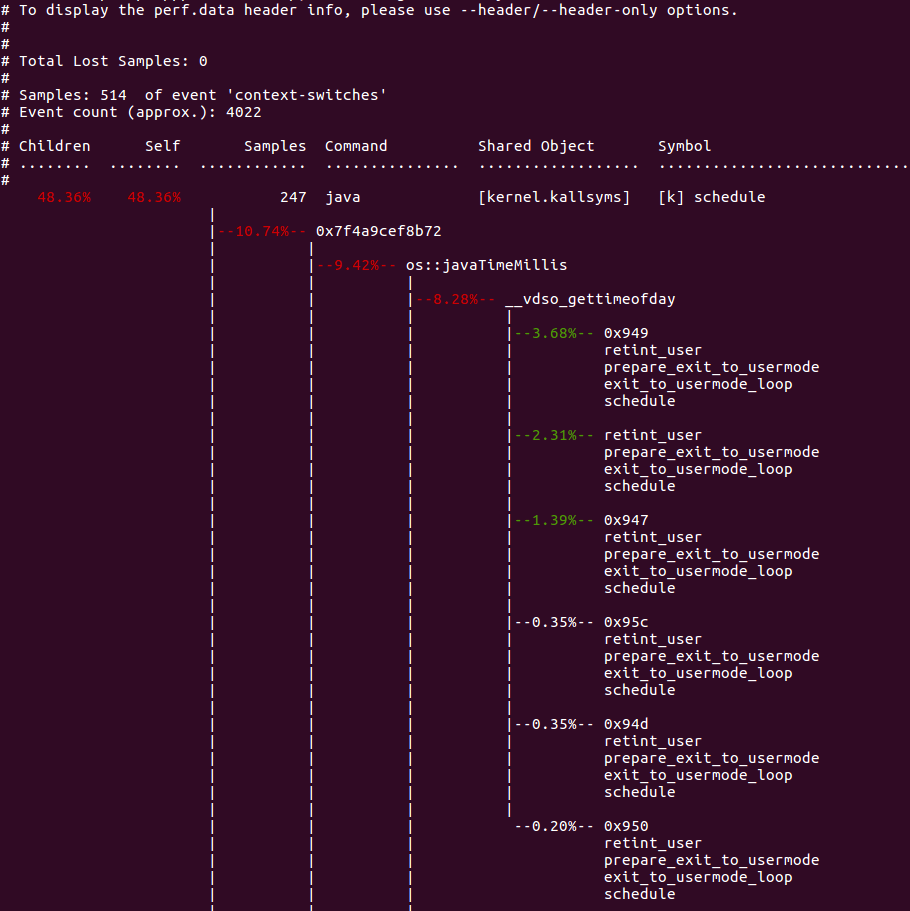
The profile data collected by perf record command are saved in perf.data binary file as seen above. perf report reads this binary file and create a report out of it.
* perf report -n : To show the profile data, “-n” shows the details of number of samples collected for each function.

* perf report -n --stdio : To generate the report with stdio interface.
Side note : Make sure to “overuse” the manual pages in perf tool. It is super helpful in listing all the options that you can use with perf commands. Use --help along with any perf command to get the manual page.
Although this write is an attempt to introduce someone to perf linux profiler, it has far too many capabilities than that can be listed in a single write-up. The followup articles will attempt to get deeper in to perf tool features & generation of Flame Graphs out of perf reports.
Happy tuning!

One thought on “[Performance] : Profiling with linux Perf command-line tool”