When it comes to Performance Monitoring and analysis, we tend to think of full fledged license tools like Dynatrace, Newrelic, Appdynamics, Yourkit etc. However, if it is a java application which is under diagnosis, java’s built in tools are a good place to start.
Java comes with a set of built-in diagnostic tools like – Jconsole, jcmd, jstat, jmap, jstack, jvisualvm, jfr and many more. Each of them help in tackling a kind of problem. For the scope of this article, lets look in to how jstat is useful as diagnostic tools.
Jstat :
To know all the capabilities of jstat utility, list the options it has like below.

Gc: Using jstat along with one of its many gc options, one can monitor live gc stats from a java application. Out of all the capabilities of jstat, I like how jstat provides extensive gc stats.
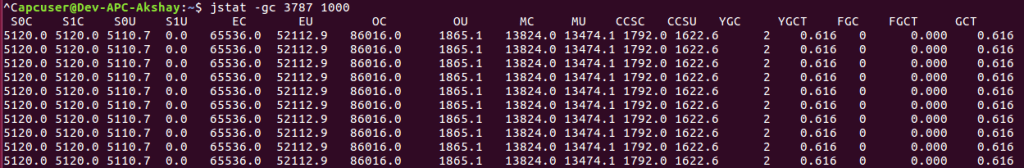
In the below snapshot – “3787” is the pid of the java application and 1000 represents the milli-second interval for every snapshot. Although the number of columns might seem overwhelming in the output below, first 12 columns speak about current capacity and current usage of a space.
First two columns “S0C” and “S1C” talk about “Current survivor space 0 capacity (kB)” and “Current survivor space 1 capacity (kB)”.
“S0U” and “S1U” talk about “Survivor space 0 utilization (kB)” and “Survivor space 1 utilization (kB)”
Similarly, the adjacent columns talk about Eden space, Metaspace and Compressed class space.
Below are the other metrics reported :
YGC: Number of young generation garbage collection events.
YGCT: Young generation garbage collection time.
FGC: Number of full GC events.
FGCT: Full garbage collection time.
GCT: Total garbage collection time.
Also, to get the gc stats for individual spaces, you could use other options like -gcmetacapacity, -gcnew, -gcold, -gcoldcapacity etc.
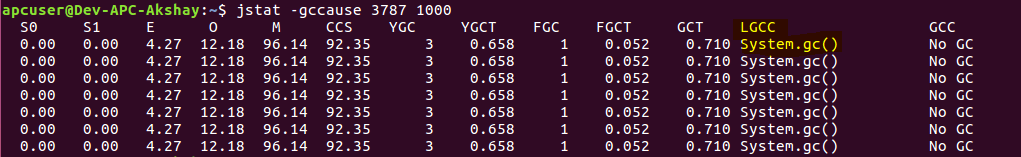
gccause : This prints the cause for the last GC and current GC.
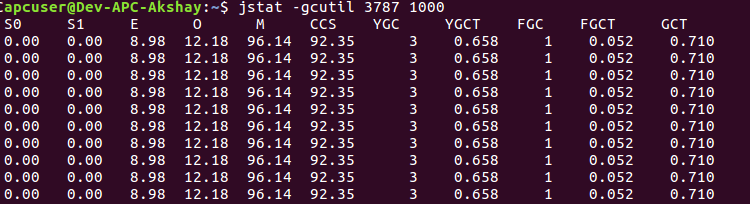
gcutil: This is the option I generally use to get the overview of Garbage collection since it gives a concise Summary of garbage collection statistics. Below stats are represented as the percentage utilization of a spaces current capacity (S0, S1, E, O, M, CCS).
YGC represents the number of young gen garbage collections since the start of process and YGCT represents the time spent on it. Similarly FGC and FGCT for Full gen.
GCT represents Total garbage collection time.
Class : This option along with jstat will display statistics about the behavior of the class loader.
As seen below, the outputs lists the number of classes loaded & unloaded, memory impact due to loading and unloading and Time spent performing class loading and unloading.
These metrics are helpful when you want to metrics around number of classes loaded for your application.

Compiler: This prints java’s virtual machine JIT compiler statistics.
As seen in below snapshot, it lists the number of classes compiled, time taken for the same, Failed compilations if any, along with Failed method details.

Official documentation link – here
Happy tuning!

Dude
Love your blog. It is now one of the sites I read regularly!.
My Wishlist for future
1) More in-depth pieces like above one and the one you did for free mem. Also put practical and personal examples if available. For e.g. when is jstat really useful
2) More frequent updates: I love it when I open your site and see new content for me to read 🙂
3) Put some kind of monetization in place: Generating this content takes time and in the long term you will only do it if you get something out of it. I would not mind some non-intrusive ads at all (no videos or pop ups please) as I want you to keep going.
LikeLike
Thank you Atin. Really appreciate all the feedback. 🙂
LikeLike